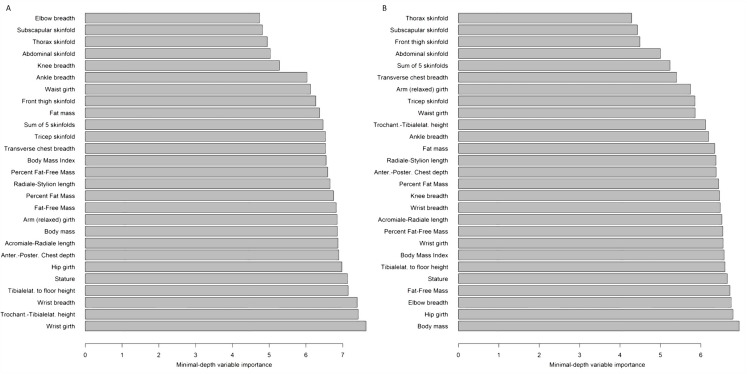
Figure 2. Representative results of Random Forests predictive variable selection.
Predictors of average performance in the 30-m dash (A) and in standing long jump (B) tests after the removal of age and sex effects; variables are ranked by minimal depth variable importance according to Random Forests analysis. Lower values indicate higher predictive power.

