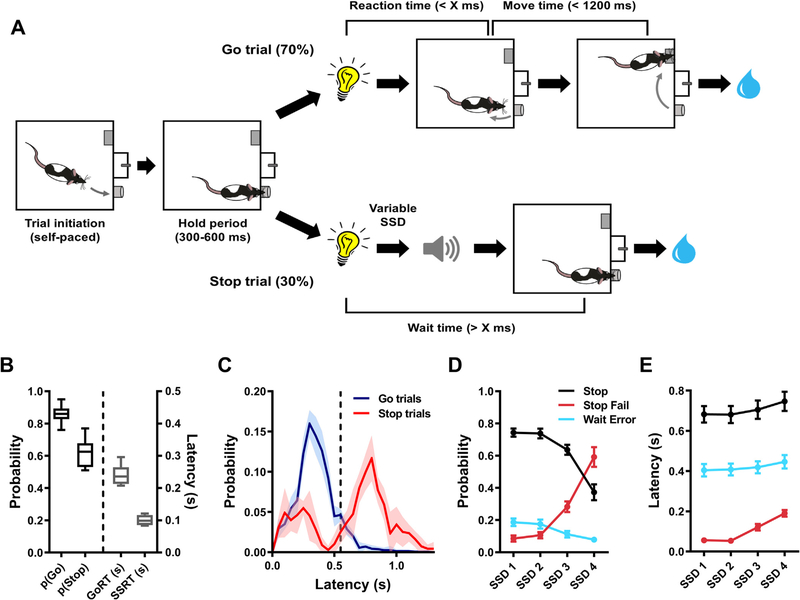
Fig. 1.
Schematic representation of the rat stop signal task and baseline behavior in the task. Panel A illustrates the flow of events during Go and Stop trials. Go reaction time (GoRT) refers to the time taken to exit the nosepoke port following the presentation of a Go cue. Movement time (MT) refers to time taken to press the lever on the opposite side of the chamber after exiting the nosepoke port (following the presentation of a Go cue). “X ms” on Go trials represents the maximum reaction time allowed for exiting the nosepoke port following presentation of the Go cue. The same cut off value was used as the minimum time the rat had to maintain fixation in the nosepoke port after the Go cue presentation on Stop trials (i.e. Wait time, WT). Prior to the first test day, X was individually titrated per rat to a value between 400 and 700 ms. The stop-signal delay (SSD) was variable across Stop trials. Correctly executed Go and Stop trials were rewarded with 60 μl of 15% sucrose water, while incorrect performance on Go (GoRT > X ms or MT > 1200 ms) or Stop trials (WT < X ms) resulted in a 5 s time out during which the house light was turned on. Panels B–E show representative baseline data in the SST. B) Box-and-whisker plots representing the 5–95 percentile data for correct Go (pGo) and Stop (pStop) trial performance as well as GoRT and estimated stop-signal reaction time (SSRT). C) Histograms showing probability distributions of latencies to exit the nosepoke port during Go or Stop trials (dashed vertical line represents the above-mentioned cut off value “X”, in this particular dataset 550 ms). Note the canonical unimodal and bimodal distributions of nosepoke port exit times during Go and Stop trials, respectively. D) Probability and E) nosepoke port exit latency data for correct (Stop) and failed (Stop Fail) Stop trials as well as Stop trials during which a waiting error was committed (Wait Error). Splitting the data across increasing SSDs highlights the differences between the three behavioral responses during Stop trials. Data from 3 training sessions from n = 10 rats (1308.5 ± 59.6 trials/rat) were used to generate plots B, D and E, while data from a single rat (2474 trials from 5 training sessions) were used to generate the histograms in C.

