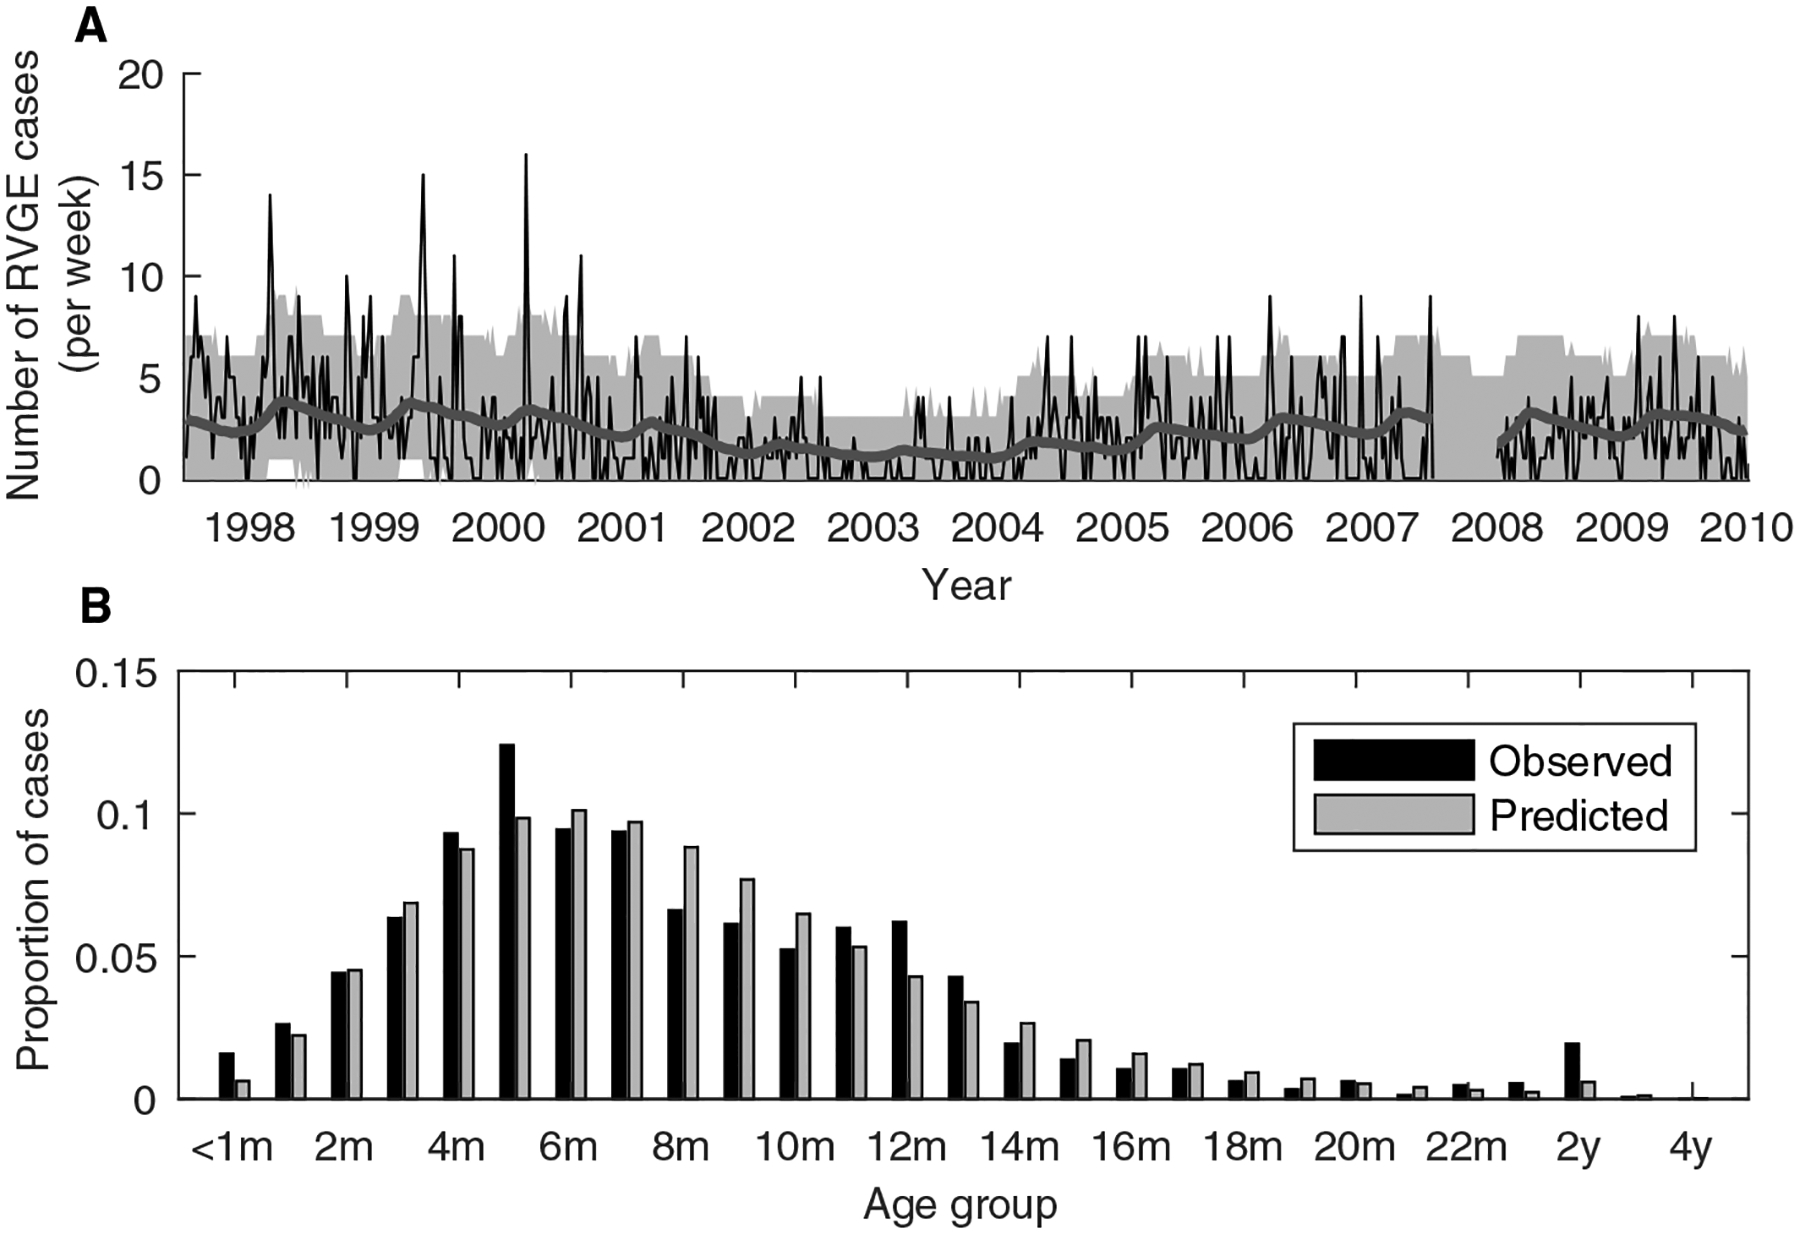
Fig. 1. Model fitted to pre-vaccination rotavirus hospitalization data.

(A) Observed (thin black line) and model-predicted (thick grey line) number of rotavirus-associated gastroenteritis (RVGE) cases per week in children <5 years of age (n=1452). The model prediction corresponds to the average number of cases per week predicted by the best-fit model (that is, the model simulated from the maximum a posteriori parameter estimates). The grey shaded region corresponds to the prediction interval when accounting for parameter uncertainty and the Poisson-distributed observation process (based on 1,000 samples drawn from the posterior distribution of fitted model parameters). (B) Proportion of cases in each age group for the observed data (black bars) and best-fit model (grey bars).
