
Fig. 2. Observed and model-predicted vaccine impact by age.
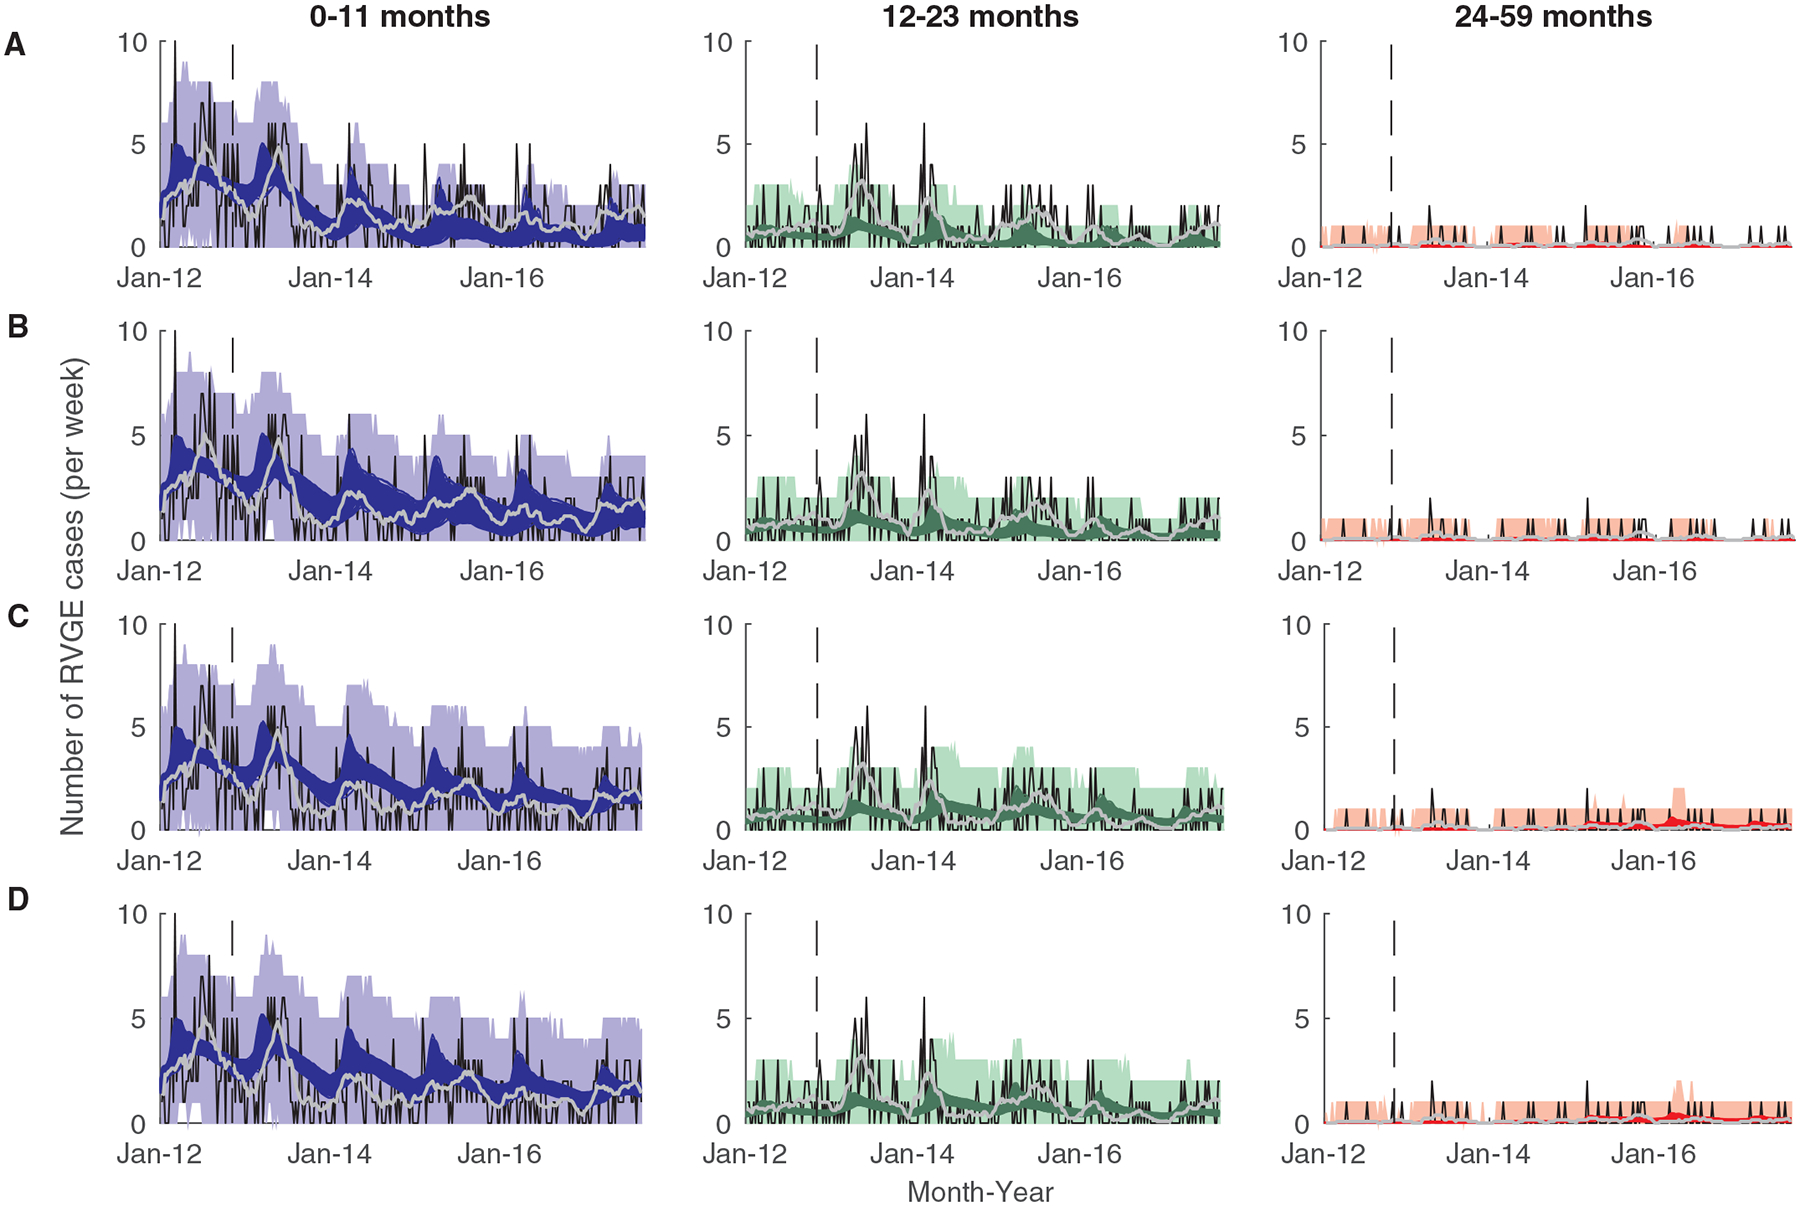
The observed (thin black lines) and model-predicted (colored lines) number of rotavirus-associated gastroenteritis (RVGE) cases per week at QECH are plotted for cases 0 to 11 months (n=539; left, blue), 12 to 23 months (n=269; middle, green), and 24 to 59 months old (n=35; right, red) for (A) Model 1, (B) Model 2, (C) Model 3, and (D) Model 4. The light grey line is the 13-week moving average of the observed number of cases, and the shaded colored regions represent the prediction intervals of the models accounting for parameter uncertainty and observation error. The vertical dashed line represents the time of vaccine introduction.