
Fig. 3. Observed and predicted vaccine effectiveness estimates by age.
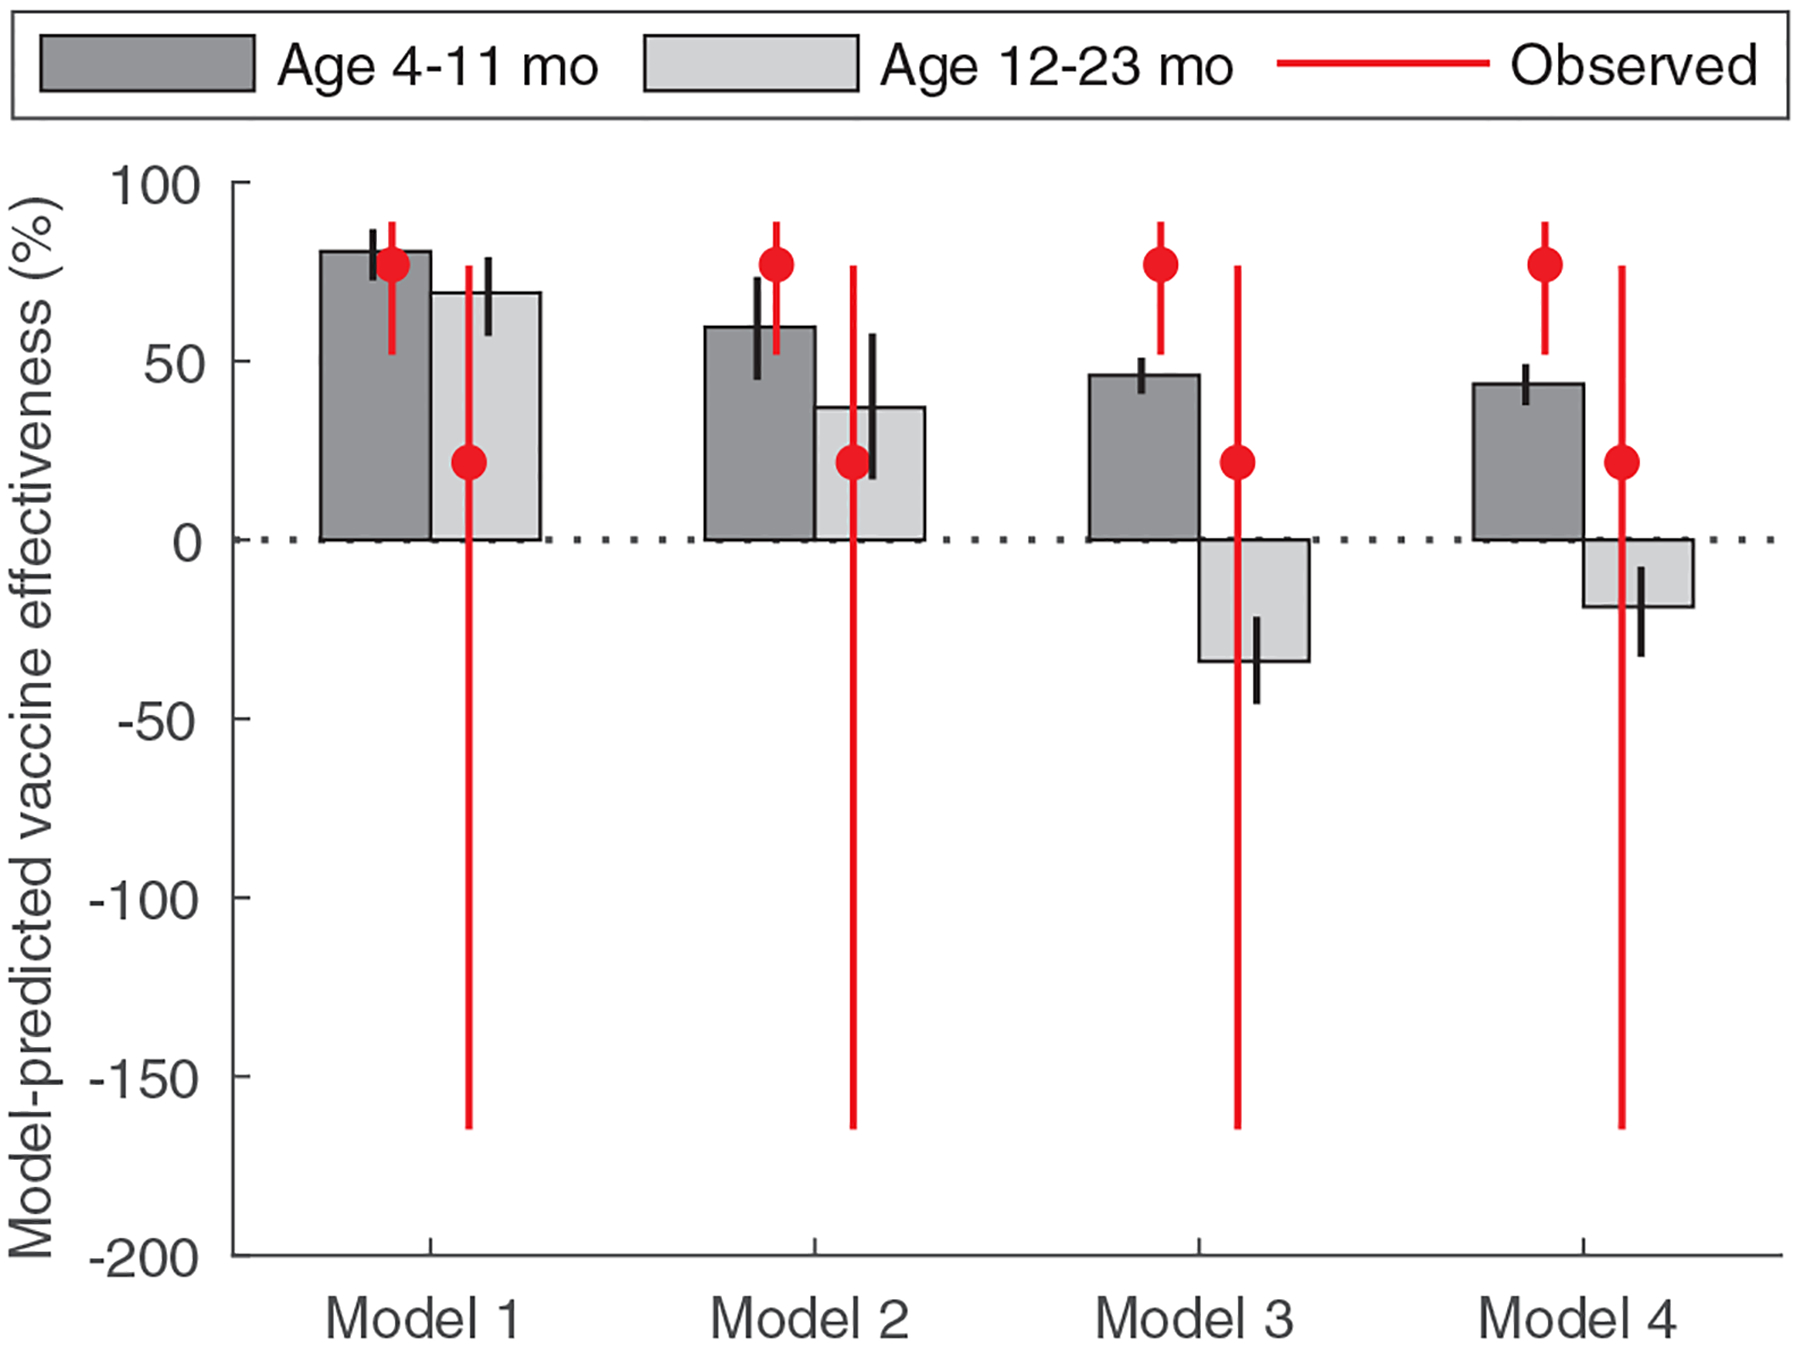
Observed (red lines) and model-predicted (grey bars) vaccine effectiveness estimates are plotted for children 4 to 11 months (n=278 cases, 655 controls) and 12 to 23 months of age (n=113 cases, 291 controls) under the four different model assumptions. The red circles represent the estimated mean vaccine effectiveness, and the red lines show the 95% confidence intervals. The black error bars represent the 95% prediction intervals associated with parameter uncertainty.