
Fig. 4. Relationship between the vaccine response, the basic reproductive number, and model-predicted vaccine effectiveness estimates.
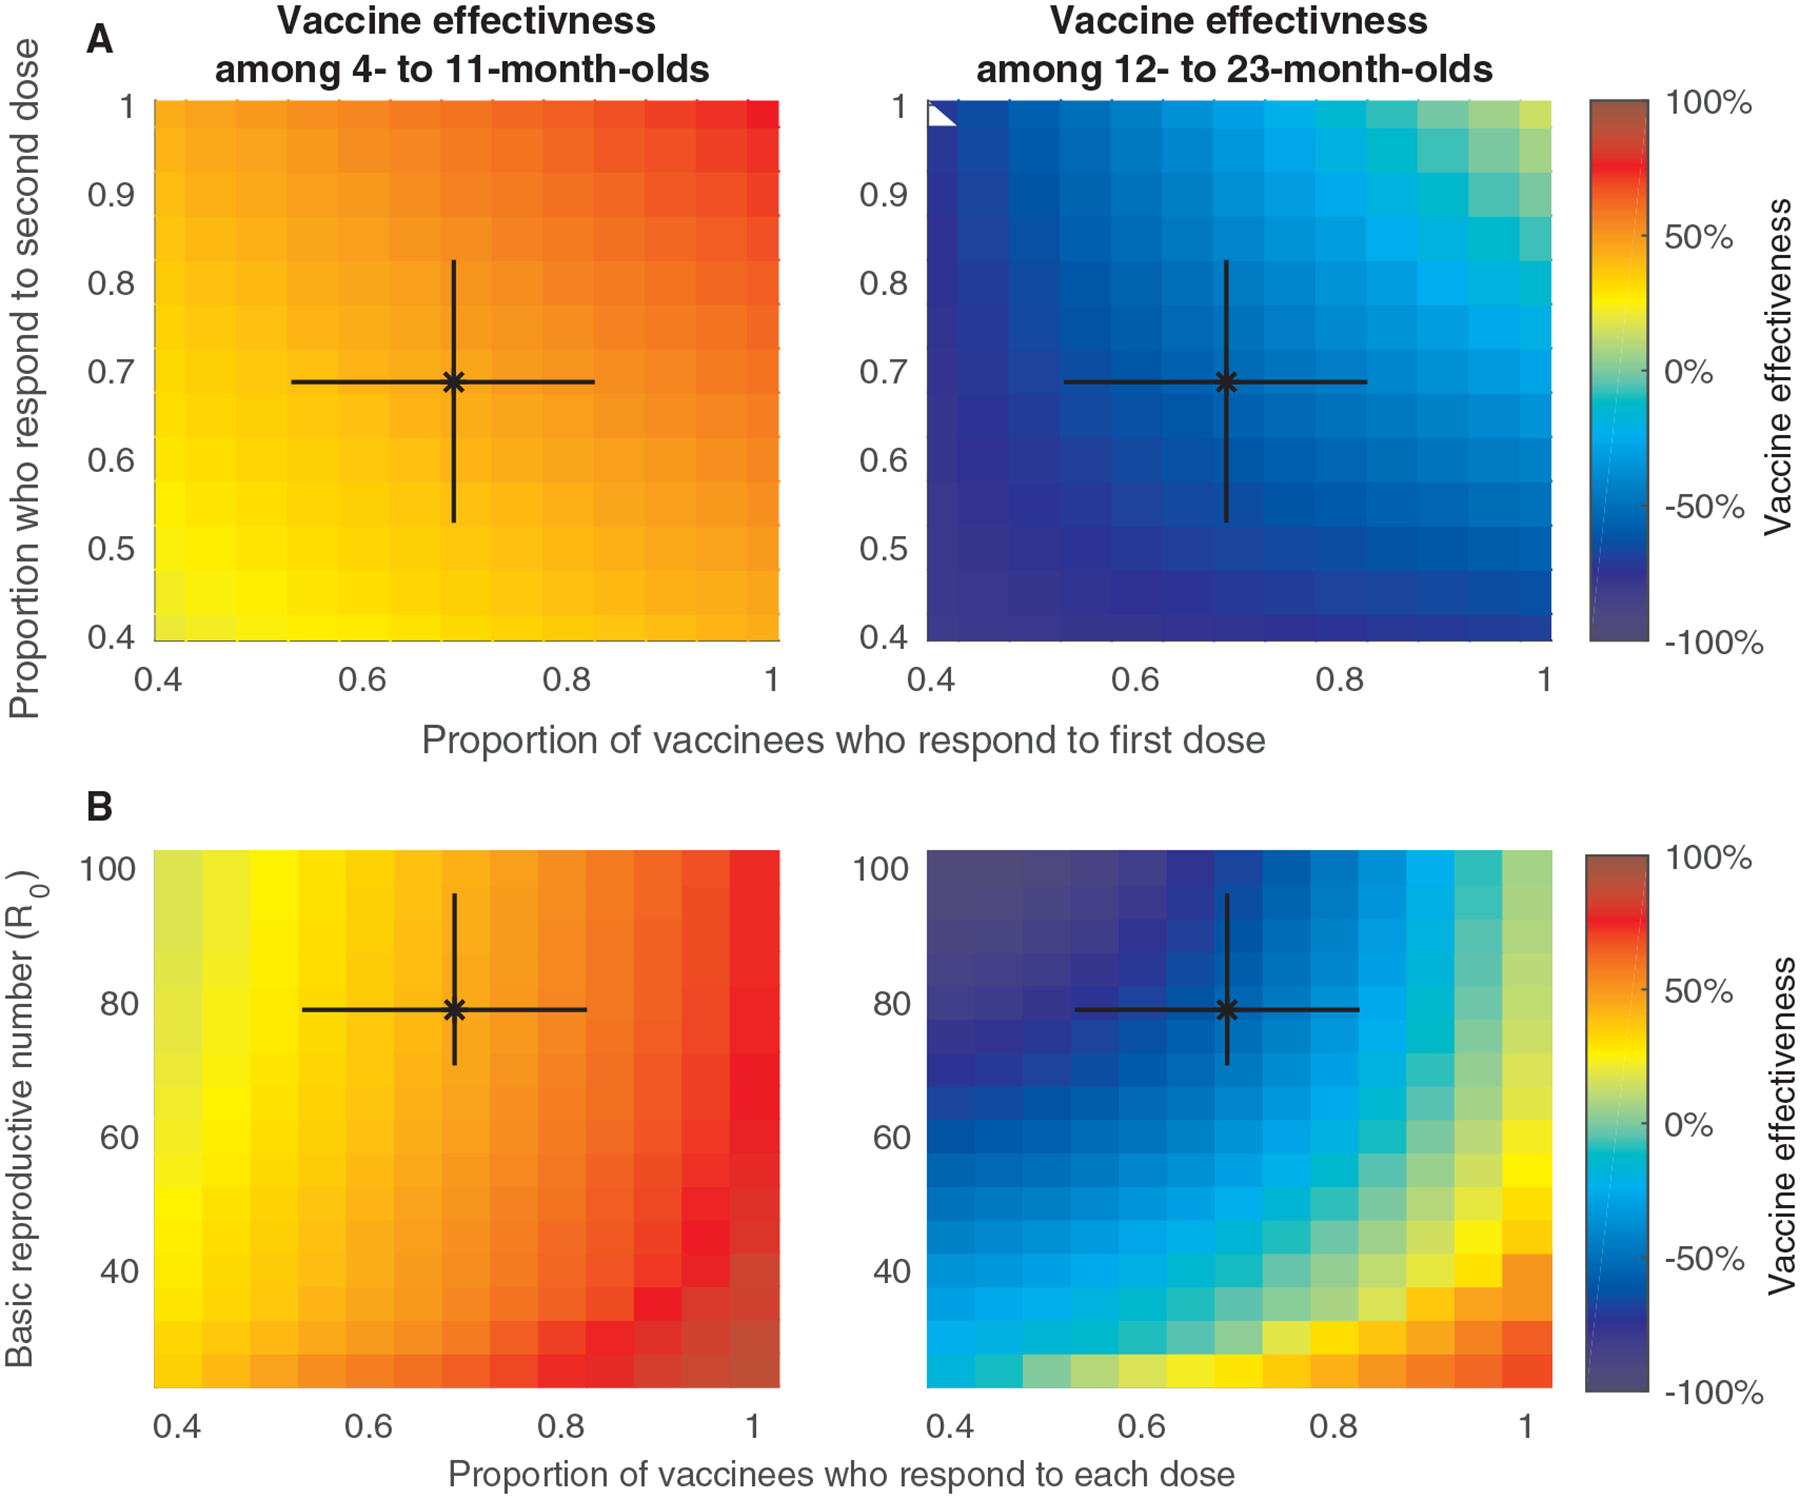
The model-predicted vaccine effectiveness estimates among (A) infants 0 to 11 months old and (B) children 12 to 23 months old is indicated by the color bar for different values of the proportion of infants who respond to the first and second dose for Model 3 (the model assuming waning of vaccine-induced immunity and no heterogeneity in vaccine response). The model-predicted vaccine effectiveness estimates among infants (C) 0 to 11 months old and (D) children 12 to 23 months old is indicated by the color bar for different values of the basic reproductive number (R0) and the proportion of infants who respond to each dose in Model 3. The black bars represent the 95% CrI of the estimated parameters for our model fitted to the pre-vaccination data for Blantyre, Malawi.