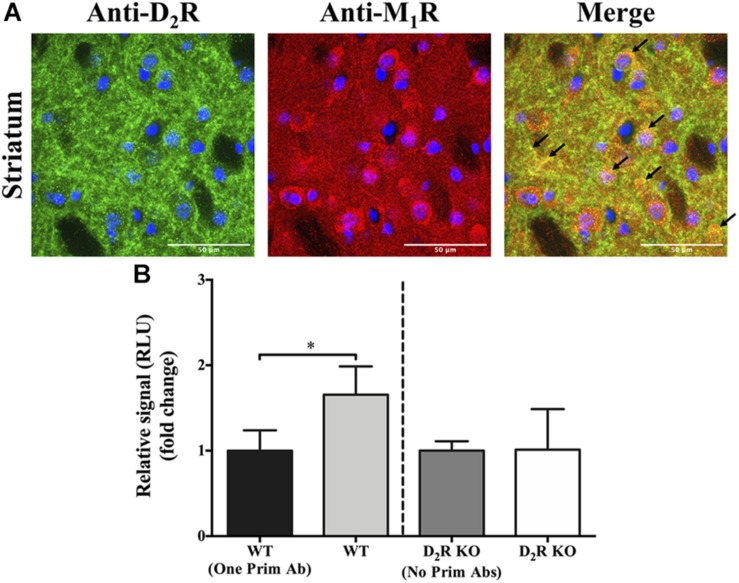
FIGURE 2.
Co-distribution of D2R and M1R in the mouse striatum. (A) Double-immunofluorescence staining. Representative images of specific immunoreactivities with anti-D2R and anti-M1R antibodies in the dorsal striatum of wild-type (WT) CD-1 mice. Overlapping immunofluorescence signals are indicated with arrows. Images shown are representative of two independent experiments. Scale bar = 50 μm. (B) AlphaLISA® immunoassay. Specific signal obtained from striatal WT and D2R KO mice, with or without adding one or two primary antibodies. Results are presented as mean ± SD (n = 4). Statistical significance was tested using the Mann–Whitney U test, *p ≤ 0.05.

