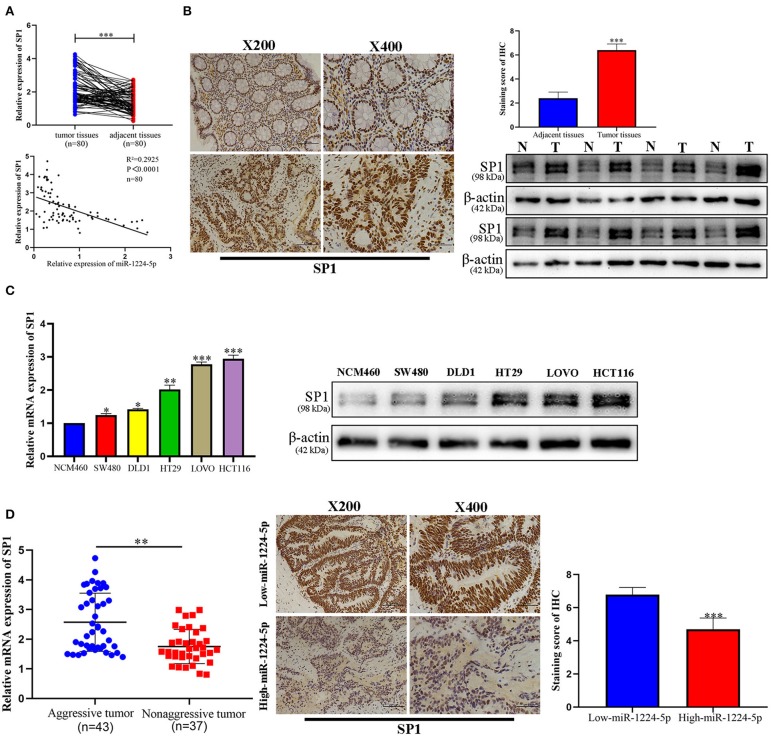
Figure 5.
Expression pattern of SP1 in CRC. (A) Expression of SP1 was upregulated in 80 paired CRC tissues compared with adjacent normal tissues and Pearson's correlation analysis showed the negative correlation of SP1 with miR-1224-5p. (B) Immunohistochemistry showed the expression level of SP1 in CRC tissues and paired adjacent normal tissues, western blot showed the expression level of SP1 protein in 8 paired CRC tissues and adjacent normal tissues. (C) Expression of SP1 mRNA and protein in CRC cell lines and normal epithelial colon cell NCM460 were detected by qRT-PCR and western blot. (D) The mRNA expression of SP1 in aggressive tumors was significantly higher than that in non-aggressive tumors, as determined by qRT-PCR. Representative immunohistochemical staining showed a weak staining of SP1 in miR-1224-5p high-expressing CRC tissue and strong staining of SP1 in the miR-1224-5p low-expressing tumor. Data represent the mean ± SD from three independent experiments. Student's t-test was used to determine statistical significance: *p < 0.05, **p < 0.01, and ***p < 0.001.

