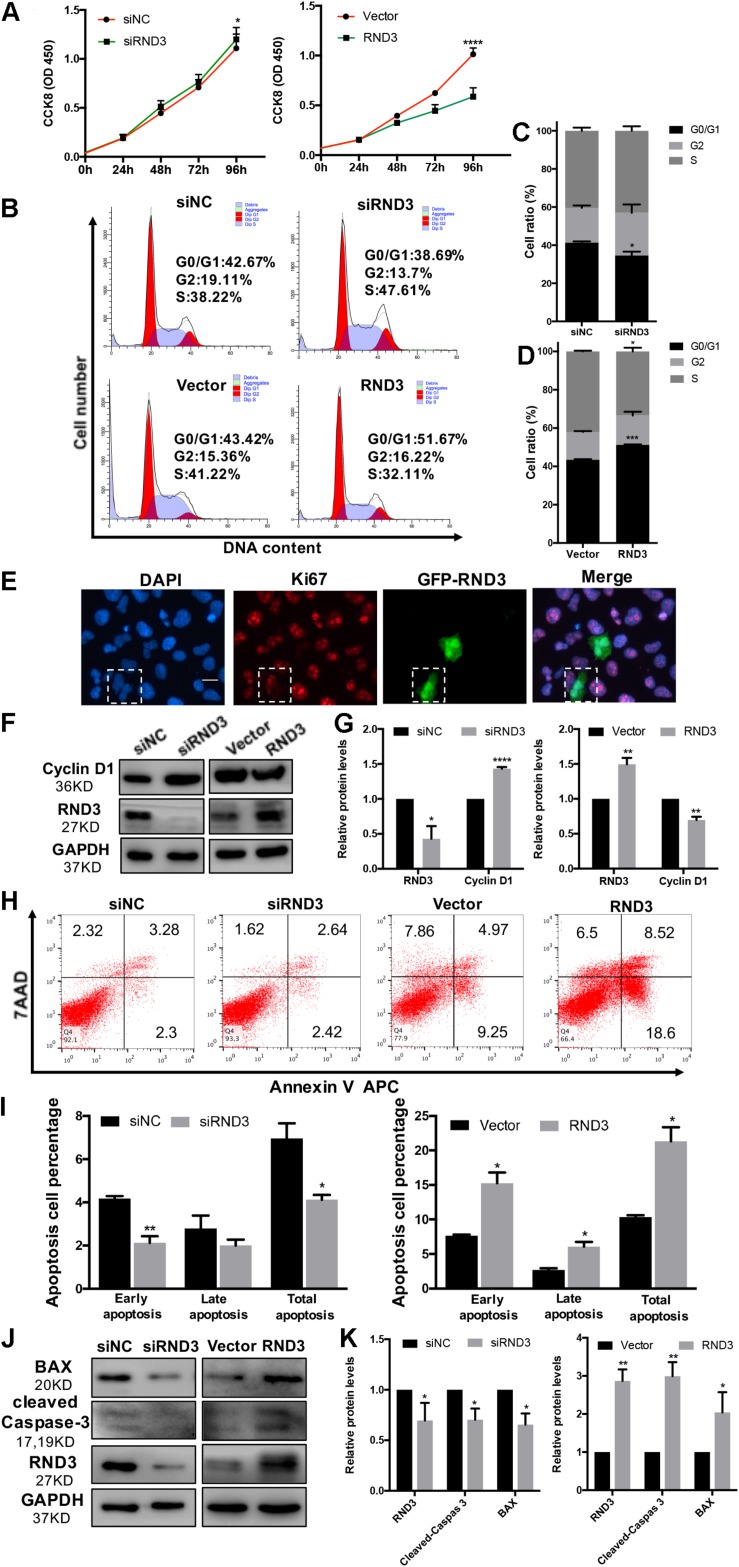
FIGURE 2.
RND3 inhibits trophoblast proliferation, blocks G1 phase cell cycle progression and promotes HTR-8 cell apoptosis. (A) CCK-8 cell proliferation assay of RND3 knockdown and RND3-overexpressing HTR-8 cells and their respective control groups. (B–D) Cell cycle assay of RND3 knockdown and RND3-overexpressing HTR-8 cells and their respective control groups. The proliferation rate of cells in each phase was assessed. (E) Immunofluorescence staining with GFP-RND3 (green), Ki-67 (red), and DAPI (blue). Original magnification: ×200. Scale bar = 25 μm. (F–G) Western blot analysis of cyclin D1 levels in RND3 knockdown and RND3-overexpressing HTR-8 cells and their respective control groups. (H,I) Flow cytometry analysis of the apoptosis rate of RND3 knockdown and RND3-overexpressing HTR8 cells and their respective control groups. Histogram of Annexin V APC+/7-AAD– represents early apoptotic cells. Histogram of Annexin V APC+/7-AAD+ represents late apoptotic cells. The sum of the former two categories equals the total number of apoptotic cells. (J,K) Western blot analysis of BAX and cleaved caspase-3 expression in RND3 knockdown and RND3-overexpressing HTR8 cells and their respective control groups. Data represent the means ± SD of three independent experiments. *P < 0.05, **P < 0.01, ***P < 0.001 vs. siNC or Vector group.

