FIGURE 3.
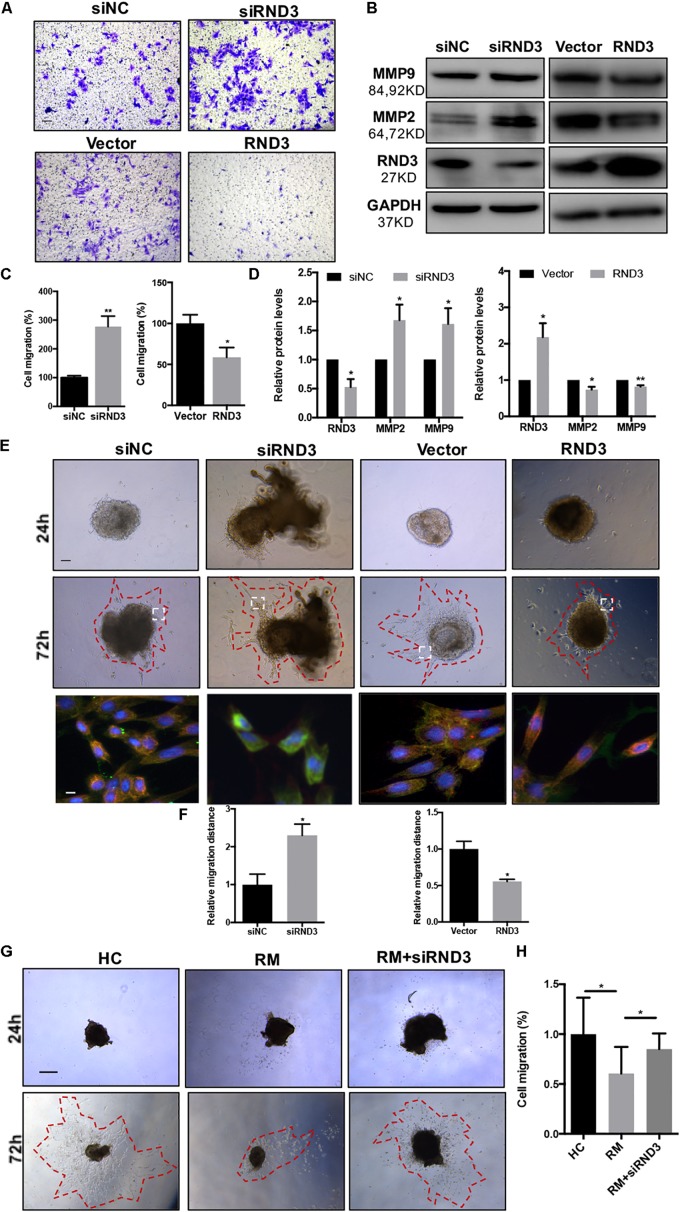
RND3 promotes trophoblast migration in vitro. (A,C) Transwell migration assay of RND3 knockdown and RND3-overexpressing HTR-8 cells and their respective control groups. Original magnification: ×100. Scale bar = 50 μm. (B,D) Western blot analysis of MMP-2 and MMP-9 expression in HTR-8 cells at 48 h after transfection with siNC, siRND3, control vector, or RND3 overexpression vector. (E,F) Villous explants were obtained from HC at 8–10 weeks of gestation and cultured on Matrigel. Tissues were then transfected with siRND3 or RND3 overexpression vector. Images were acquired after in vitro culture for 24 and 72 h. Original magnification: ×100. Scale bar = 100 μm. Immunofluorescence staining images of trophoblasts expressing RND3 (red) and CK7 (green). Original magnification: ×200. Scale bar = 25 μm. (G,H) Villous explants were obtained from HC and RM at 8–12 weeks of gestation and cultured on Matrigel. RM tissues were then transfected with siRND3. Images were acquired after in vitro culture for 24 and 72 h. Original magnification: ×40. Scale bar = 200 μm. Data represent the means ± SD of three independent experiments. *P < 0.05, **P < 0.01 vs. siNC, Vector, HC or RM group.

