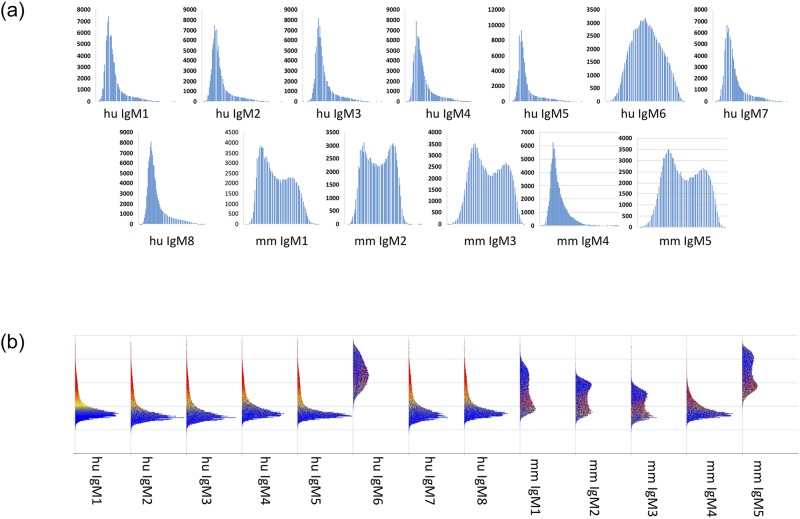
Fig 6. Data distribution for monoclonals shown in Fig 4.
Data for all 125,000 peptides from CIM125K are shown as a density plot, either one by one (top plots) or side-by-side (bottom plot). For the distributions shown along the bottom, blue color indicates low intensity binding while yellow and red indicate higher binding at least above the median signal for that array. Antibodies are shown in the same order as Fig 4. Wide/broad distributions match promiscuous binding of specific antibodies, narrow distributions suggest more specific binding. No other serological test performed on any of these antibodies led investigators to predictions of efficacy, but therapeutic efficacy of these IgM antibodies correlated perfectly with the broad distributions and relatively high entropy scores.

