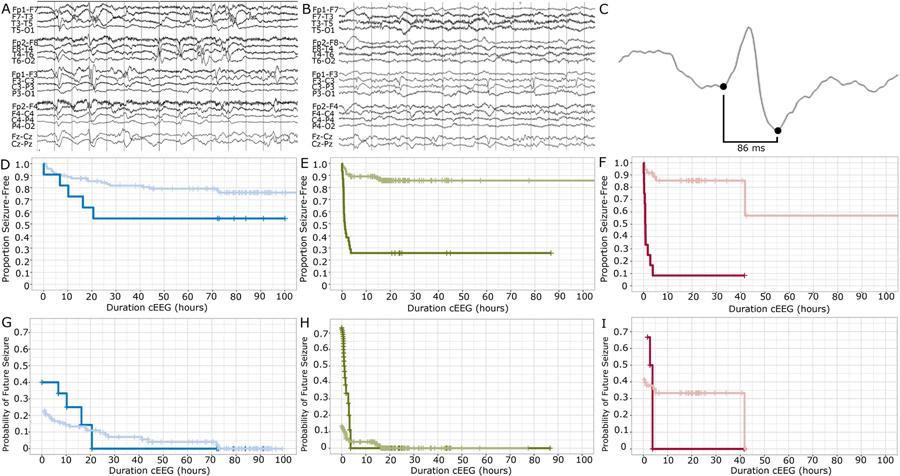
Figure 4: Probability of future seizure in the presence or absence of early epileptiform activity.
A) Example neonatal early EEG recording demonstrating broad, multifocal, excessive sharp transients. B) Example neonatal early EEG recording demonstrating consistent focal epileptiform discharges. C) Example fast epileptiform discharge (<100 ms) from an early neonatal EEG recording. D-F) Kaplan-Meier survival curves for D) Acute neonatal encephalopathy (blue), E) Suspicious clinical event (green), and F) Other high-risk indications (red) groups separated by the presence (dark) or absence (light) of epileptiform discharges on early EEG. G-I) Probability of future seizure separated by the presence (dark) or absence (light) of epileptiform discharges in the early EEG record, according to monitoring indication: G) Acute neonatal encephalopathy (blue) H) Suspicious clinical event (green) I) Other high-risk indications (red).

