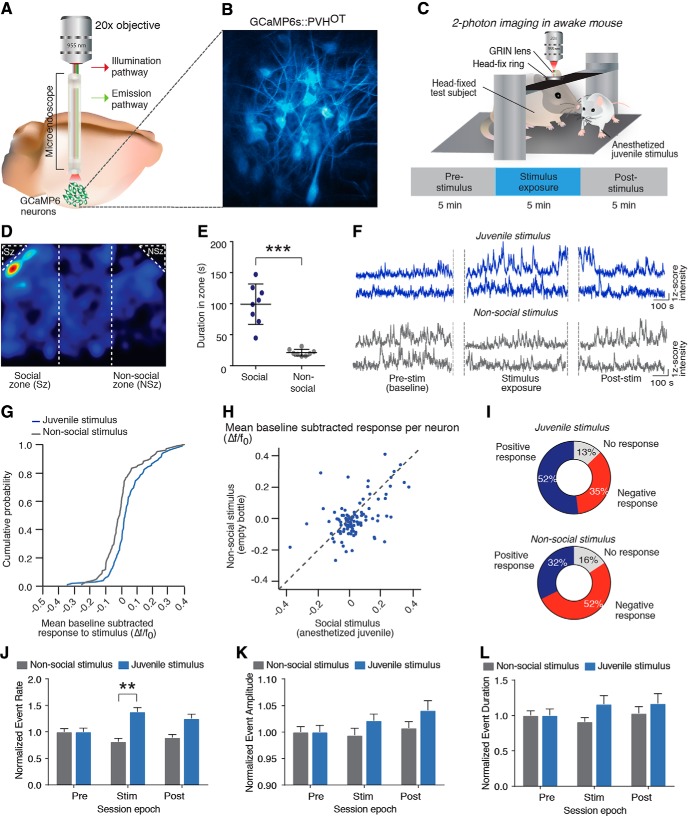
Figure 3.
Social stimuli increase activity of a subpopulation of PVH-OT neurons. A, A GRIN lens was implanted above the PVH and a 20× objective was used to visualize calcium changes in PVH-OT neurons. B, SD projection of GCaMP6s expressing PVH-OT neurons. C, Diagram of 2-photon imaging experiments in an awake, head-fixed mouse. D, Representative activity heat map from a wild-type mouse investigating stimulus chambers containing either and anesthetized juvenile (social zone, left) or a plastic bottle (nonsocial zone, right). E, Mice show a strong preference for investigating the anesthetized juvenile (social stimulus) over the empty bottle (nonsocial stimulus) (n = 8). F, Representative calcium traces following exposure to the social stimulus (top) or the nonsocial stimulus (bottom). G, A greater proportion of PVH-OT neurons showed increases in activity to the social stimulus, while a greater proportion of PVH-OT neurons showed decreases in activity to the nonsocial stimulus. H, Scatter plots showing mean baseline subtracted activity for each neuron to the social (x-axis) and nonsocial (y-axis) stimulus for each neuron. I, Functional classification of OT neurons following exposure to either a social or nonsocial stimulus. J–L, Exposure to a social stimulus increased the (J) event rate of PVH-OT neurons, but did not alter (K) event amplitude or (L) or event amplitude. **p ≤ 0.005, ***p ≤ 0.0005.

