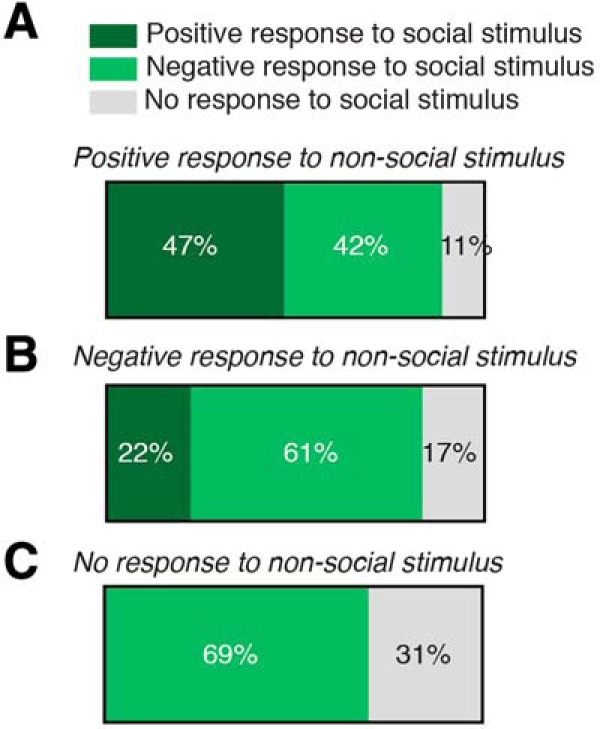
Figure 4.

Characterization of PVH-OT neuron activity to social and nonsocial stimulus. A–C, Neurons were first grouped by their response to the social stimulus (positive, negative, or no response) and the response profile of each of these groups of neurons was then determined for the nonsocial stimulus. A, For neurons that responded with an increase in activity to the social stimulus, 47% of these neurons also showed an increase in activity to the nonsocial stimulus, 42% showed a decrease in inactivity, and 11% showed no change in activity. B, For neurons that showed a negative response to the social stimulus, 22% of these neurons showed an increase an activity to the nonsocial stimulus, 61% exhibited a decrease in activity to the nonsocial stimulus, and 17% of these neurons did not change their activity. C, For neurons that did not change their activity upon presentation of the social stimulus, 69% of these neurons decreased their activity to the nonsocial stimulus and 31% did not have a change inactivity. None of these neurons responded with an increase in activity to the nonsocial stimulus.
