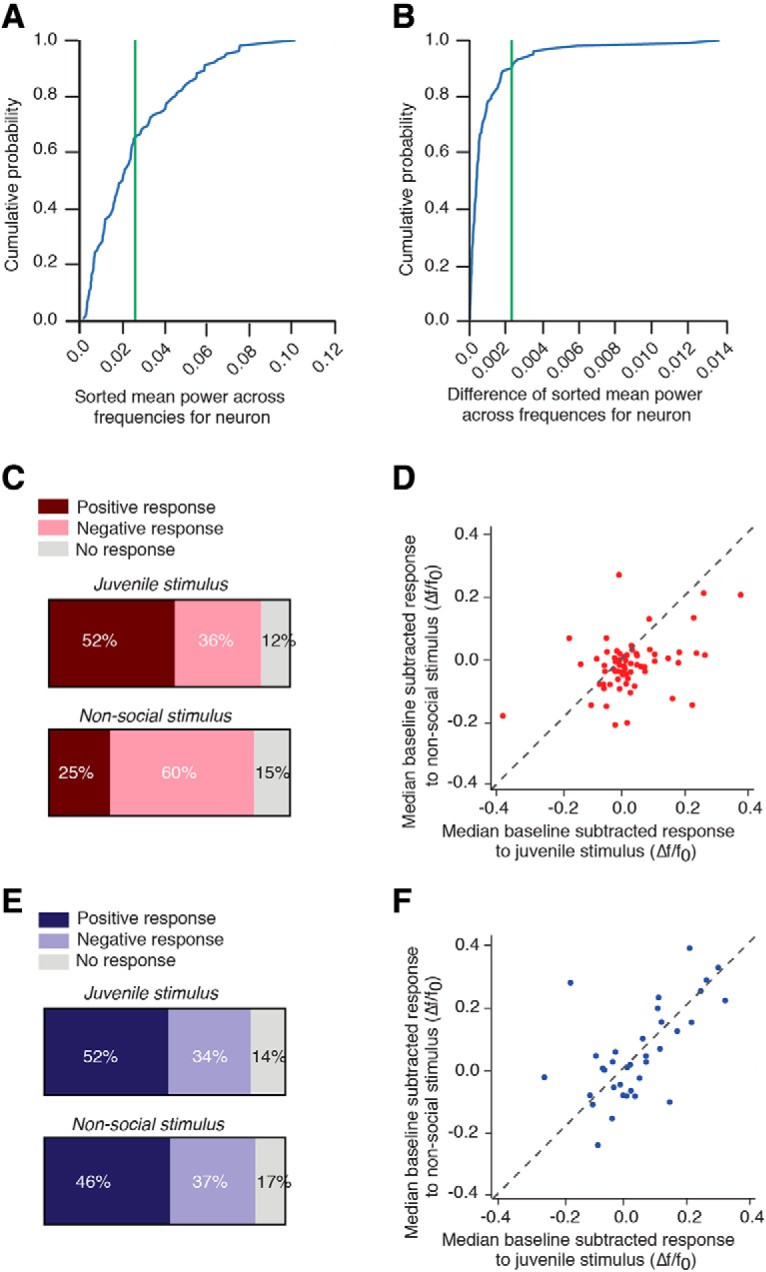
Figure 5.

Heterogeneous activity patterns in PVH-OT neurons. A, Cumulative probability distribution plots of sorted mean power across frequency. Green line indicates location of “knee” found in B. B, Cumulative probability distribution plot of difference between each neuron sorted by mean power. C, PVH-OT neurons categorized as low-power neurons primarily responded to increases in activity to the social stimulus and decreases in activity to the nonsocial stimulus. D, Scatter plot showing the mean baseline subtracted response to the social (x-axis) and nonsocial stimulus (y-axis) for individual low-power neurons. E, High-power PVH-OT neurons showed similar activity patterns to the social and nonsocial stimulus. F, Scatter plot showing the mean baseline subtracted response to the social and nonsocial stimulus for individual high-power neurons.
