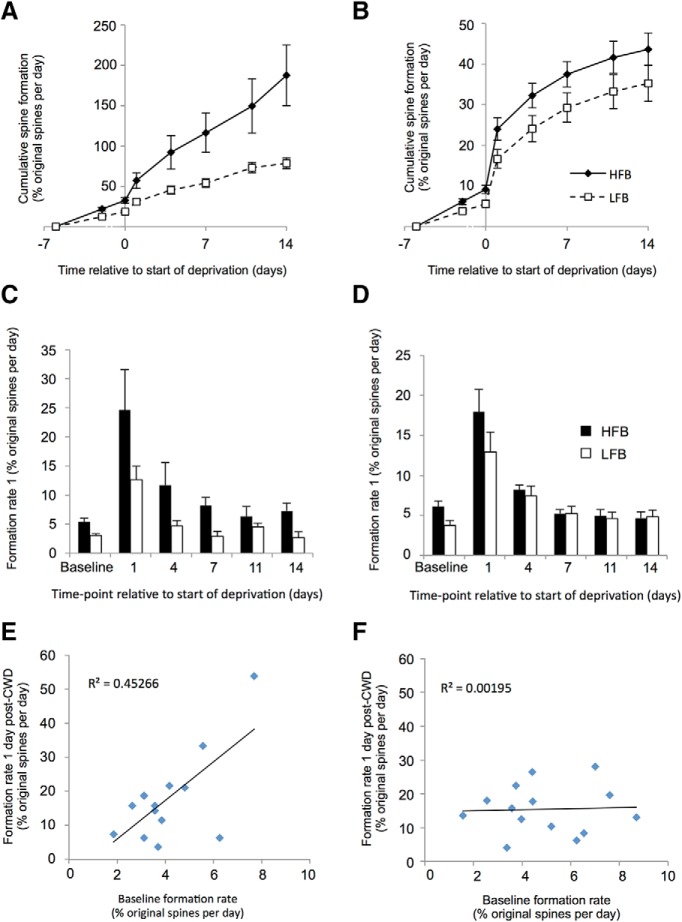
Figure 4.
Effect of basal formation rate on chessboard pattern whisker deprivation induced formation rate in bifurcating dendrites and randomly paired singly assayed dendrites. A, Bifurcating dendrites: the HFBs (solid lines, black diamonds) from the bifurcation pair are defined from their baseline formation rate and show a greater reaction to deprivation than LFBs (dashed lines, open squares). Plot represents the cumulative spine formation with time. B, Random pairs: HFBs from randomly paired branches appear to show a greater reaction to deprivation, but this is not significantly different from the LFB random pair. C, Bifurcating pairs: formation rate plotted in histogram format showing rates assayed per time point for HFBs (black bars) and LFBs (white bars). D, Random pairs: formation rates for randomly paired dendrites. E, Cross-correlation between basal formation and deprivation induced formation rates in bifurcation dendrite pairs. Basal formation is broadly predictive of deprivation induced formation (r2 = 0.45) and is highly significant (see Results). F, Basal formation rate is not predictive of deprivation induced formation rate for randomly assigned pairs of dendrites (r2 = 0.00195).

