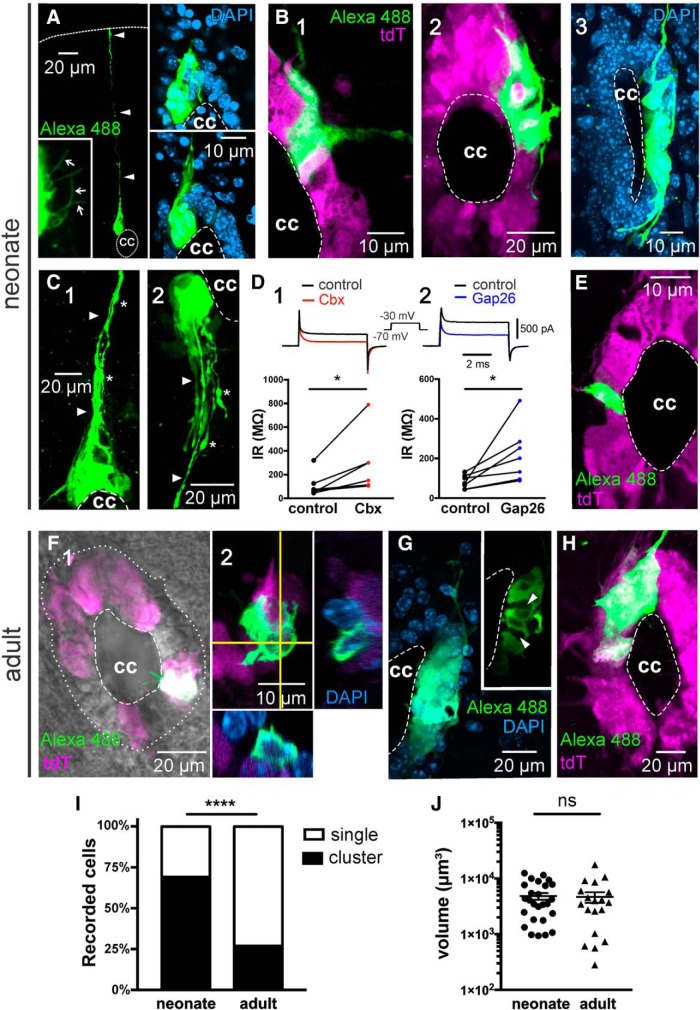
Figure 2.
Gap junction coupling between ependymal cells is developmentally downregulated. A, Cluster of dye-coupled cells contacting the CC in the neonatal spinal cord (stack of 58 confocal optical sections). Some cells in the cluster had processes that project to the dorsal raphe, reaching the pia matter (arrowheads). Several cilia (bottom left, inset, arrows) are seen on the apical pole of clustered cells (stack of sections 12–21). Right, Insets, Two confocal optical sections with DAPI counterstaining to illustrate that dye-coupled cells are within the ependymal cell layer. B, Clusters of dye-coupled cells cover variable portions of the CC. B1, A small cluster of dye-coupled cells comprising a discrete extension of the dorsolateral aspect of the CC. B2, A cluster covering the dorsolateral half of the CC (stack of 64 optical sections). Some dye-coupled cells covered the whole lateral aspect of the CC (B3, stack of 86 optical sections). C, Clustered cells often showed processes (arrowheads) that projected toward the dorsal (C1) or ventral (C2) raphe (stacks of 43 and 60 optical sections, respectively). Numerous varicosities (C1,C2, asterisks) could be observed at some distance of the CC. D1, Cbx (100 μm) and Gap26 (D2, 200 μm) increased the IR in cells that were dye-coupled to their neighbors. Top, Representative currents induced by a voltage step from −70 to −30 mV before and after the gap junction blockers. E, A minority of recordings in the ependyma of neonate mice revealed single cells (stack of 8 optical sections). F, Ependymal cell in the adult CC (F1). The cell had two conspicuous cilia. Orthogonal projections combined with DAPI staining confirm that the image corresponds to a single tdTomato+ cell (F2). Stack of 28 optical sections. G, In a few cases, the recorded cells in the adult ependyma was part of a cluster of gap junction-coupled cells (stack of 38 optical sections). Inset, The single optical plane shows that the cluster engulfed ependymal cells that were not coupled (arrowheads). H, Cluster of dye-coupled cells in the adult spinal cord of a FoxJ1CreER-tdTomato mouse (stack of 39 optical sections). I, Plot represents that the incidence of coupling was significantly lower in the adult CC (p < 0.0001). J, The volume of clusters of dye-coupled cells in the neonate and adult CC was not significantly different (p = 0.40). A, B3, C, G, Data obtained from C57BL/6J mice. In this and subsequent figures, dorsal is facing upward. *p < 0.05, ****p < 0.0001, ns = non significant.

