Figure 5.
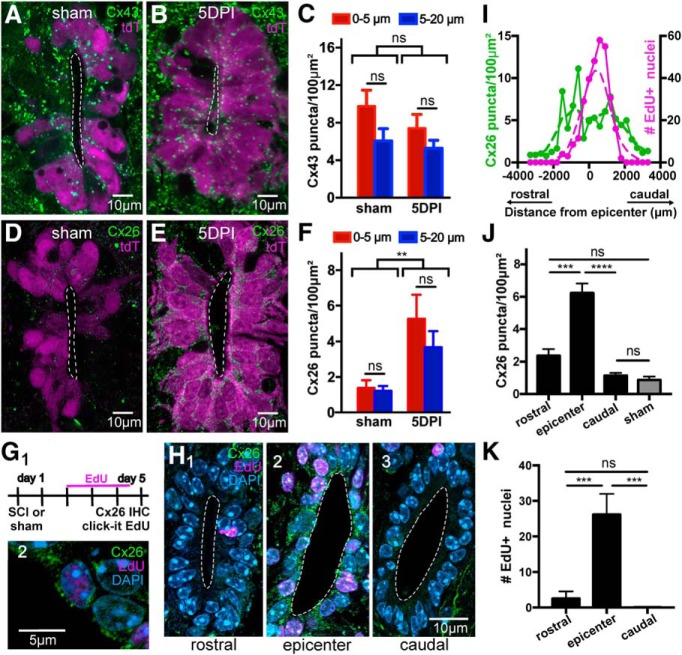
Injury-induced plasticity of connexin signaling in the CC. A, B, Expression profile of Cx43 in sham-injured and 5 DPI mice, respectively. C, Density plots of Cx43 puncta in sham and injured animals at 5 DPI show no significant difference (p = 0.26). D, E, Expression profile of Cx26 in sham-injured and 5 DPI mice, respectively. F, The density of Cx26 puncta increased dramatically at 5 DPI compared with control animals (p < 0.01). G1, Experimental design to study the correlation between proliferation and Cx26 expression. G2, An EdU+ nucleus from a cell expressing Cx26. H, Representative images of EdU uptake and Cx26 immunohistochemistry at rostral (H1), epicenter (H2), and caudal (H3) levels. I, Spatial profile of Cx26 density (green) and EdU+ nuclei (magenta) at 5 DPI. The lesion epicenter is located at 0 in the abscissa. J, Bar graph of the density of Cx26 puncta in a region around the lesion epicenter (0–2 mm around the epicenter) and in neighboring rostral and caudal regions (2–4 mm away from the epicenter). The density of Cx26 puncta in the sham-injured spinal cord is also shown (gray bar). K, Number of EdU+ nuclei in the same regions as in the plot in J. All images are single confocal optical planes. G–K, Data obtained in C57BL/6J mice. **p < 0.01, ***p < 0.001, ****p < 0.0001, ns = non significant.

