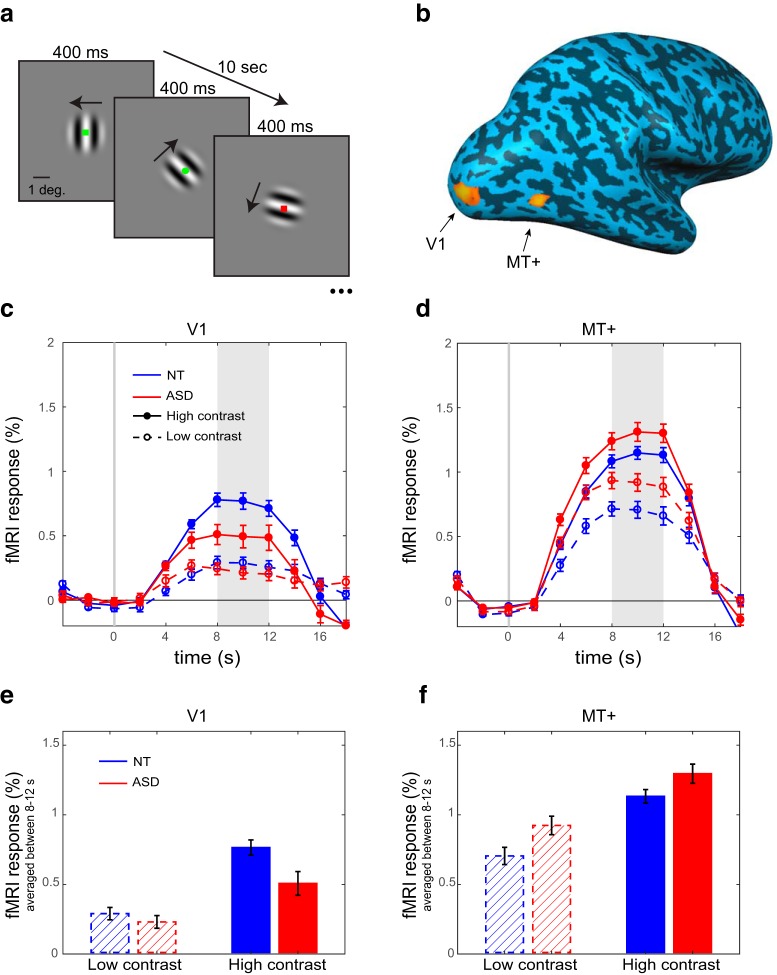
Figure 1.
Task, ROIs, and fMRI responses. a, Drifting gratings (2° diameter) were presented in the center of the screen, changing direction every 400 ms. Stimuli were high contrast (98%) or low contrast (3%) in different blocks. Participants were asked to press a button when a green circle appeared. Blocks were 10 s long and alternated with 10 s blocks of the fixation task only. b, ROIs in left and right V1 and MT+ were defined using independent localizer scans. ROIs in the right hemisphere are shown for an example NT participant overlaid on an inflated cortical surface. (c, d) time courses and (e, f) average magnitude of peak fMRI responses of NT (blue) and ASD (red) participants, for high contrast (solid lines) and low contrast (broken lines) stimuli. Shaded regions in c-d deonte the time window for averaging in e-f. Error bars denote standard error of the mean (S.E.M). ASD responses are higher than NT responses in MT+ but lower in V1.

