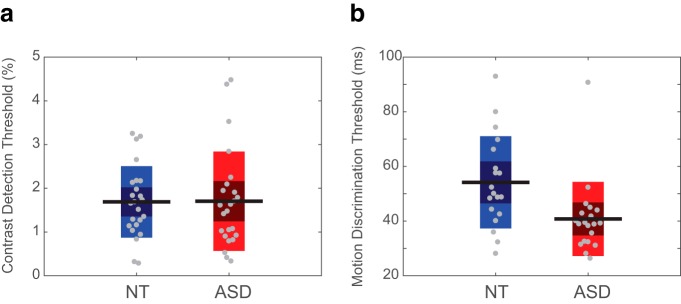
Figure 10.
Visual psychophysics performance. a, Contrast detection thresholds are similar across ASD and NT participants. b, Motion discrimination thresholds are lower in ASD than in NT, indicating higher motion sensitivity. Gray circles represent individual participants, horizontal black lines represent group mean. Dark-shaded areas represent 1 SD from the mean, and the colored bars represent a 95% confidence interval around the mean.

