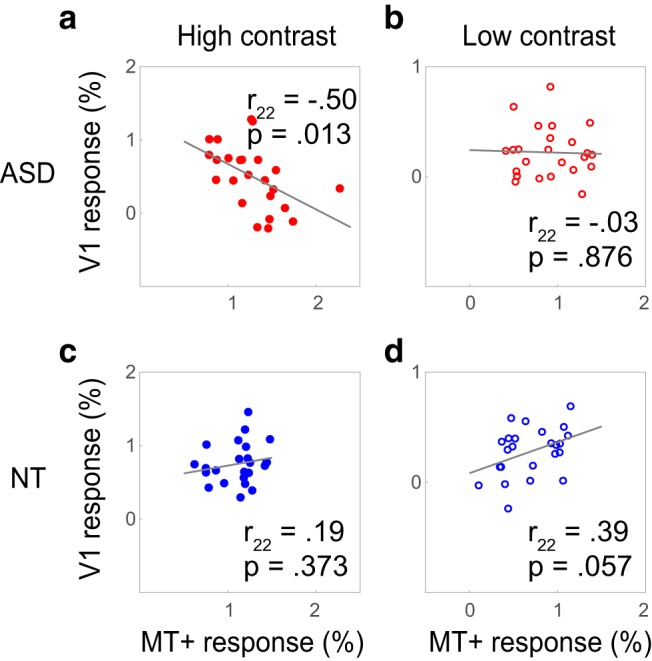
Figure 3.

V1 and MT+ response correlations. Negative correlations between response magnitude in V1 and MT+ among the ASD group (a, b), i.e., participants with high MT+ responses have low V1 responses. The opposite is true for NT (c, d), where V1 and MT+ magnitudes are positively correlated.
