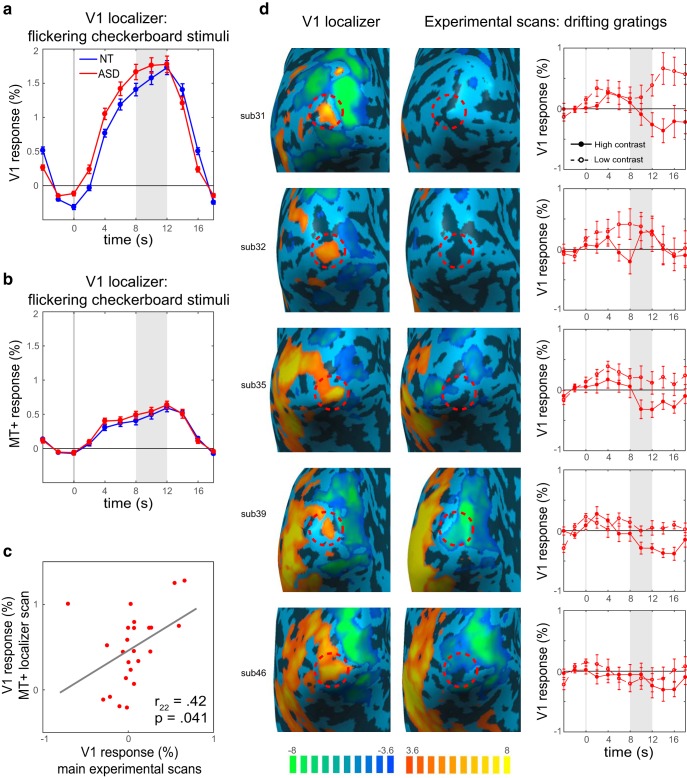
Figure 4.
FMRI responses to the localizer stimuli, and drifting grating responses in individuals with strong V1 attenuation. a, ASD fMRI responses to flickering checkerboard stimuli are robust and similar to the responses in NT. b, MT+ responses to flickering checkerboard stimuli are low and similar between groups. c, V1 responses during the MT+ localizer scan, where MT+ is strongly activated, are correlated with responses to drifting gratings during the main experimental scans, demonstrating that individuals with attenuated responses show this pattern across scans. d, Individual participants with the most V1 attenuation. Early visual cortex responses to flickering checkerboard stimuli during the localizer scan (first column) with V1 ROI denoted with a red dashed circle. The responses in the same regions to high contrast drifting gratings during the experimental scans (second column) were low or even below baseline. For some, responses to high contrast stimuli were lower than responses to low contrast stimuli (third column). The values in the brain maps represent t values from a GLM analysis. Shaded regions in the timecourses denote time window for averaging the peak magnitude of fMRI response. Error bars denote S.E.M.

