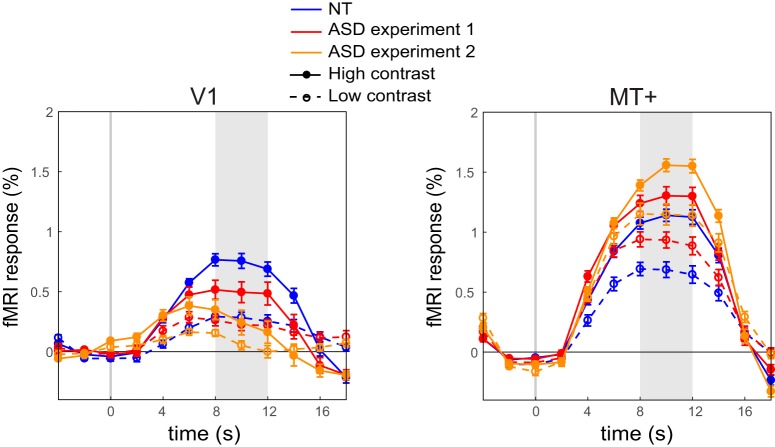
Figure 8.
Replication of Low V1 and high MT+ responses in ASD. ASD participants who attended Experiment 2 were also rescanned with the original paradigm from Experiment 1, to examine the repeatability of the findings. Attenuation of V1 and amplification of MT+ were replicated in this second scan. Shaded regions denote time window for averaging the peak magnitude of fMRI response. Error bars denote S.E.M.

