Figure 1.
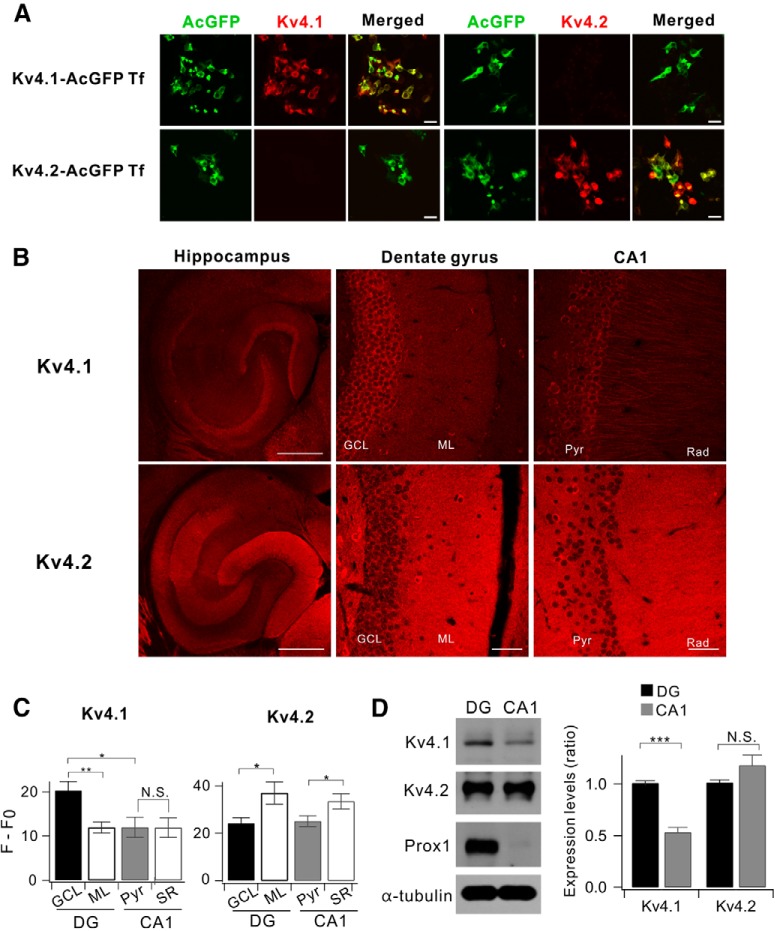
Comparison between Kv4.1 and Kv4.2 expression in the hippocampus. A, Both Kv4.1 and Kv4.2 antibodies selectively recognize the channel in HEK293 cells. HEK293 cells were transfected with either AcGFP-tagged Kv4.1 cDNA (Kv4.1-AcGFP Tf) or Kv4.2 (Kv4.2-AcGFP Tf). Forty-eight hours after transfection, the cells were stained using Kv4.1 or Kv4.2 antibodies. Scale bar, 20 μm. B, Representative fluorescence immunostaining images show that Kv4.1 (top) is highly expressed in DG while Kv4.2 (bottom) is broadly expressed in the hippocampus of 8-week-old mice. Scale bars, 500 μm (left) and 50 μm (middle and right). C, Summary bar graphs of the relative fluorescence intensity (F − F0) shown in the DG and CA1 for Kv4.1 (n = 10, left) and Kv4.2 (n = 5, right). (Kv4.1; GCL, 20.3 ± 2.0; ML, 11.9 ± 1.3; Pyr, 12.0 ± 2.3; Rad, 11.9 ± 2.2; GCL vs ML, p = 0.0037; GCL vs Pyr, p = 0.013; Pyr vs Rad, p = 0.97; Kv4.2; GCL, 24.2 ± 2.3; ML, 39.1 ± 5.8; Pyr, 25.1 ± 2.3; Rad, 33.5 ± 3.3; GCL vs ML, p = 0.037; Pyr vs Rad, p = 0.016). D, Western blot analysis for Kv4.1 and Kv4.2 in DG and CA1 of 8-week-old mice. Right, DG exhibits higher Kv4.1 expression level compared with CA1; 1.00 ± 0.02 in DG, 0.53 ± 0.05 in CA1, n = 8; p < 0.0001. Paired t test. Prospero-related homeobox 1 (Prox) and α-tubulin used as a marker for DG and loading control, respectively. *p < 0.05, **p < 0.01, ***p < 0.001, N.S. (not significant) p > 0.05 by Student's t-test.

