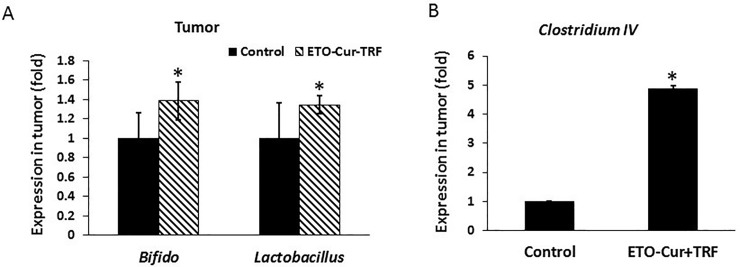
Fig 6.
Changes in the relative abundance of (A) Bifidobacteria and Lactobacillus and (B) Clostridium IV in the xenograft of SCID mice 34 days following administration of Cur-ETO-TRF or vehicle (controls) as determined by qPCR (50 ng DNA/sample) with specific primers and each sample ΔΔCT values were calculated by normalizing to the CT value of total Eubacteria. Bars represent mean of three reading standard deviation; *p<0.01, compared to the corresponding control.

