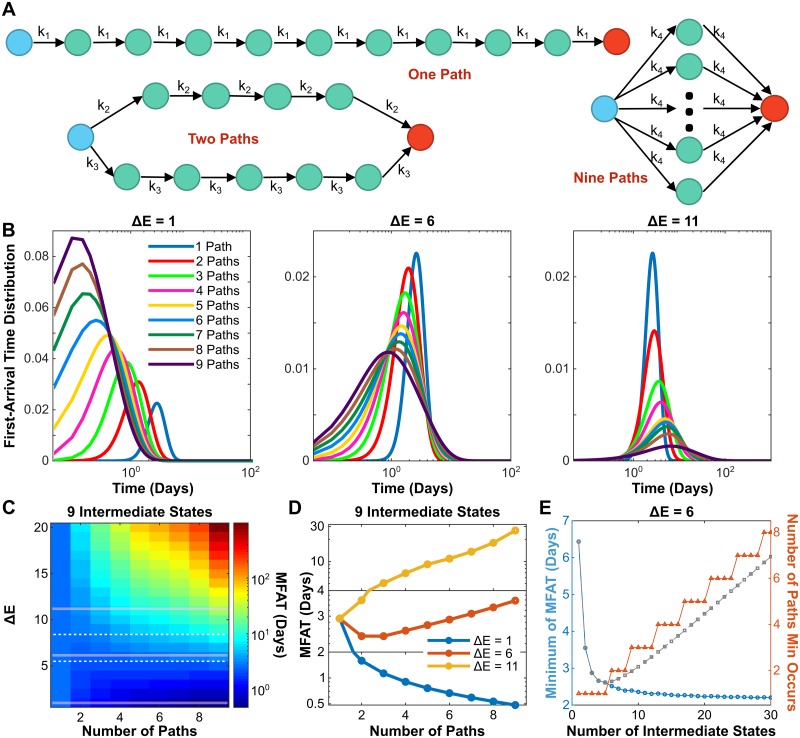
Fig 3. Adding parallel paths can further accelerate the EMT process.
(A) Diagram of cell phenotype transition through nine intermediate states with multiple parallel paths. (B) Dependence of FAT distribution on Npth with three different ΔE values and Nint = 9. (C) Phase diagrams showing MFAT subjected to Npth and ΔE with Nint = 9. Dashed lines represent two thresholds for monotonic and non-monotonic dependence of MFAT on Npth. (D) Three typical examples show the monotonic and non-monotonic dependence of MFAT on Npth according to ΔE value. (E) The dependence of minimal MFAT (blue curve) with a comparison to one parallel path (grey dashed line), and the Npth the minimum occurs on (red) for ΔE = 6.

