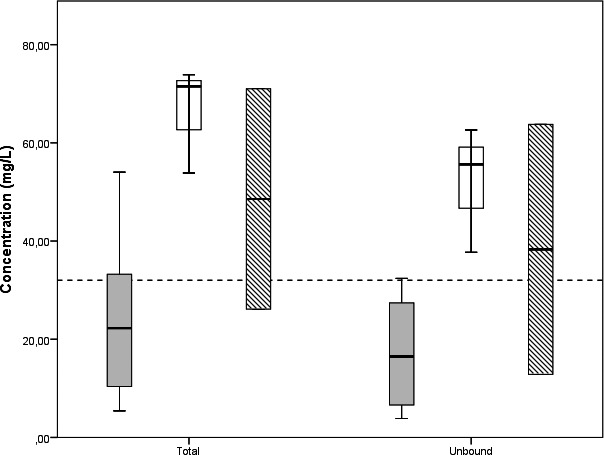
Figure 5.

Box plots sorted by sampling time. Box plots showing interquartile ranges with median, minimum, and maximum concentrations of cefuroxime measured in the patient cohort. Intra‐individual difference in total and unbound concentration of cefuroxime is shown on the X‐axis. The Y‐axis represents the measured concentration of cefuroxime. The dashed line represents 4*MIC (32 mg/L). For clarity, only trough (plain grey), mid (striped), and peak (plain white) samples are shown. N = 12 trough samples, N = 3 mid samples, and N = 2 peak samples were obtained from 10 ICU patients
