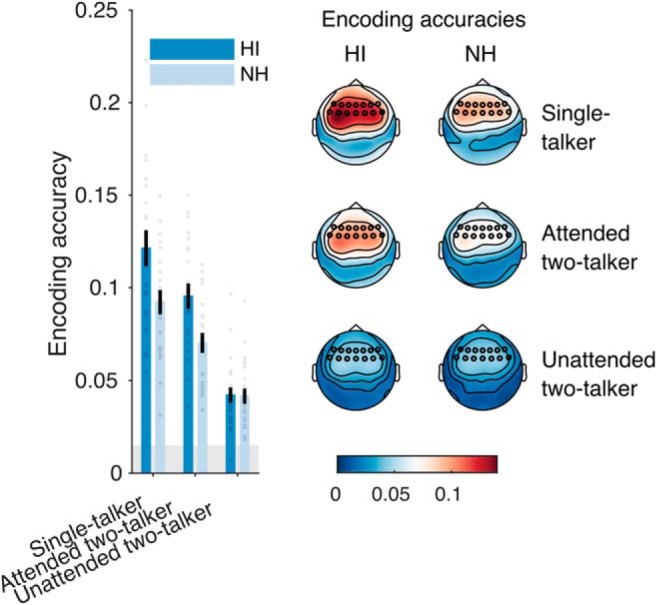
Figure 3.

Results from the encoding analysis. Left, Group mean encoding accuracies averaged over fronto-central electrodes. Encoding accuracies indicate the correlation between speech envelope model predictions and EEG data from NH (light blue) and HI (dark blue) listeners. Each point represents data from a single subject. Error bars represent SEM. The shaded area indicates the estimated noise floor. Right, Topographies showing group-mean encoding accuracies at each electrode site.
