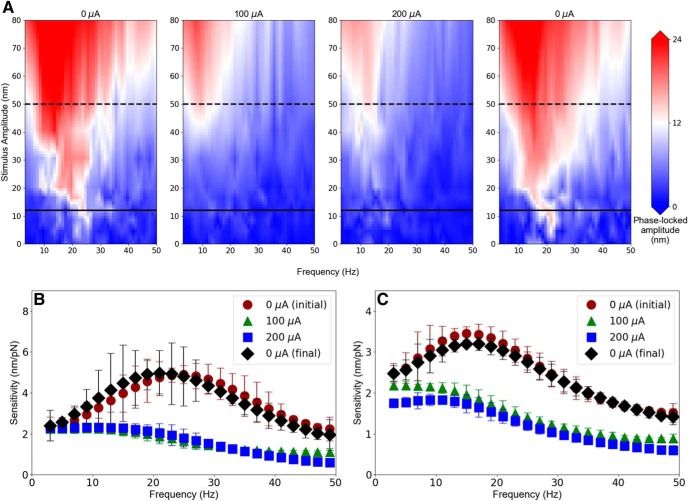
Figure 10.
Receptive field maps of a hair cell were obtained with and without efferent stimulation. A, Each plot was constructed by mechanically driving the bundle at 24 frequencies (3–50 Hz in 2 Hz increments) with 10 mechanical stimulus amplitudes (0, 4, 8, 12, 16, 20, 30, 40, 50, and 80 nm). The first and last panels represent measurements obtained in the absence of efferent stimulation. The second and third panels represent the mechanical response of the bundle measured while the efferent neurons were stimulated with pulse trains (3 ms “on”/10 ms “off”) of 100 and 200 μA amplitudes, respectively. Each combination of mechanical stimulus frequency and amplitude was presented for 10 cycles. Linear interpolation was applied along the stimulus amplitude direction to yield the color maps. The bundle shows decreased phase-locking and frequency selectivity with efferent stimulation. The sensitivity curves at glass probe base displacements of (B) 12 nm (corresponding to the solid lines in A) and (C) 50 nm (corresponding to the dashed lines in A) demonstrate that the cell's sensitivity decreased upon efferent actuation. Circles, triangles, squares, and diamonds represent sensitivity curves with efferent stimulus amplitudes of 0 (initial), 100, 200, and 0 μA (final), respectively. The sensitivity curves were smoothed by applying a running average of three data points. Error bars indicate the SDs from these means.

