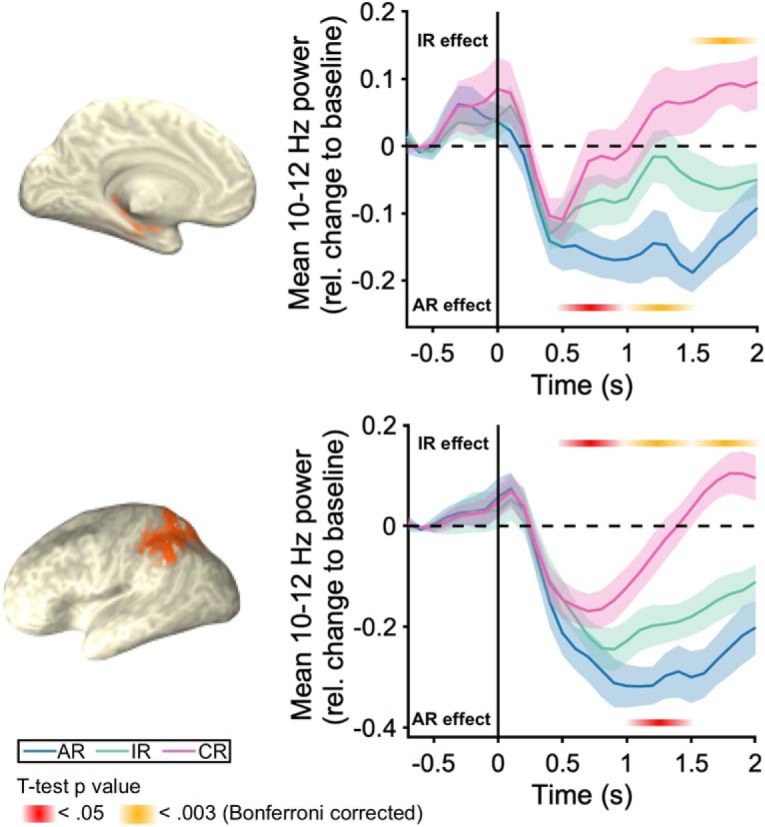
Figure 4.

Hippocampus and PPC alpha source power time courses. 10–12 Hz alpha source power for AR, IR and CR. Brain maps depict the regions of interest selected for this analysis based on the AAL atlas (Tzourio-Mazoyer et al., 2002). Top panel depicts alpha power time courses in the hippocampus. Bottom panel includes inferior and superior parietal lobules. Orange and yellow horizontal lines depict significant 500 ms time windows resulting from post hoc pairwise tests.
