
Figure 2.
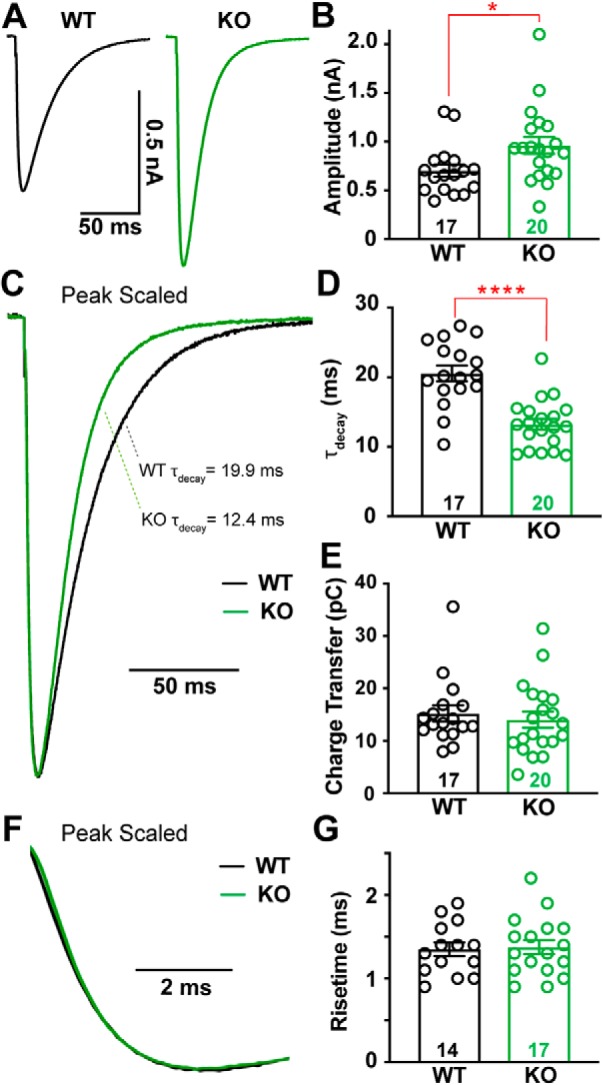
CF-evoked EPSCs are larger and faster in Cacna2d2 KO mice, but total charge transfer is conserved. A, Representative CF-evoked EPSCs. Left, WT average (black); right, KO average (green). B, Average peak CF EPSC amplitude; *p < 0.05. C, Peak scaled EPSCs, demonstrating the relative decay time constants for these example traces (τdecay) based on single exponential fits; WT (black) and KO (green). D, τdecay (ms) for CF EPSCs in WT vs KO PCs; ****p < 0.0001. E, Average charge transfer within the first 100 ms of EPSC; p = 0.58 (NS). F, Peak scaled EPSCs, expanded to display risetime kinetics; WT (black) and KO (green). G, Average CF EPSC 20–80% risetime (ms); p = 0.83 (NS). Data are shown as ± SEM, n = cells; unpaired Student's t test.