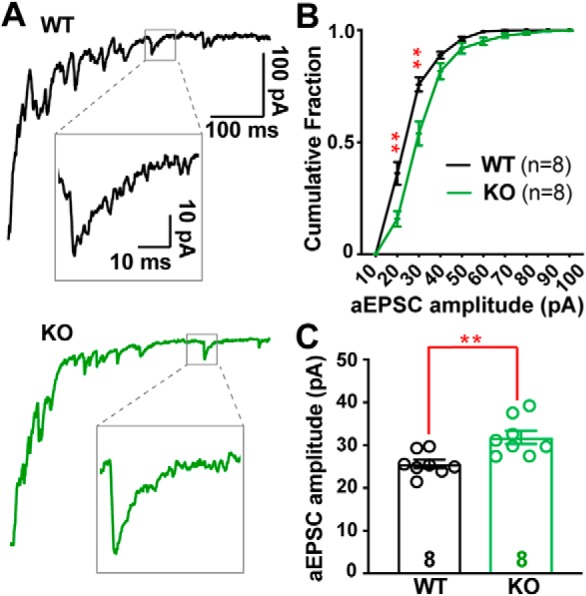
Figure 3.

Desynchronized CF-evoked vesicle release reveals larger quantal responses in Cacna2d2 KO. A, Representative CF-evoked EPSCs in the presence of 1.3 mm Sr2+; top, WT EPSC (black) and example asynchronous EPSC (aEPSC; inset); bottom, KO EPSC (green) and aEPSC (inset). B, Cumulative aESPC amplitude distribution graphed in 10 pA bins; WT (black) and KO (green); **p < 0.01 for 20 and 30 pA bins, all others NS (multiple t tests with Holm–Sidak correction for multiple comparisons). C, Average aEPSC amplitudes; **p < 0.01. Data are shown as ± SEM, n = cells; unpaired Student's t test.
