
Figure 4.
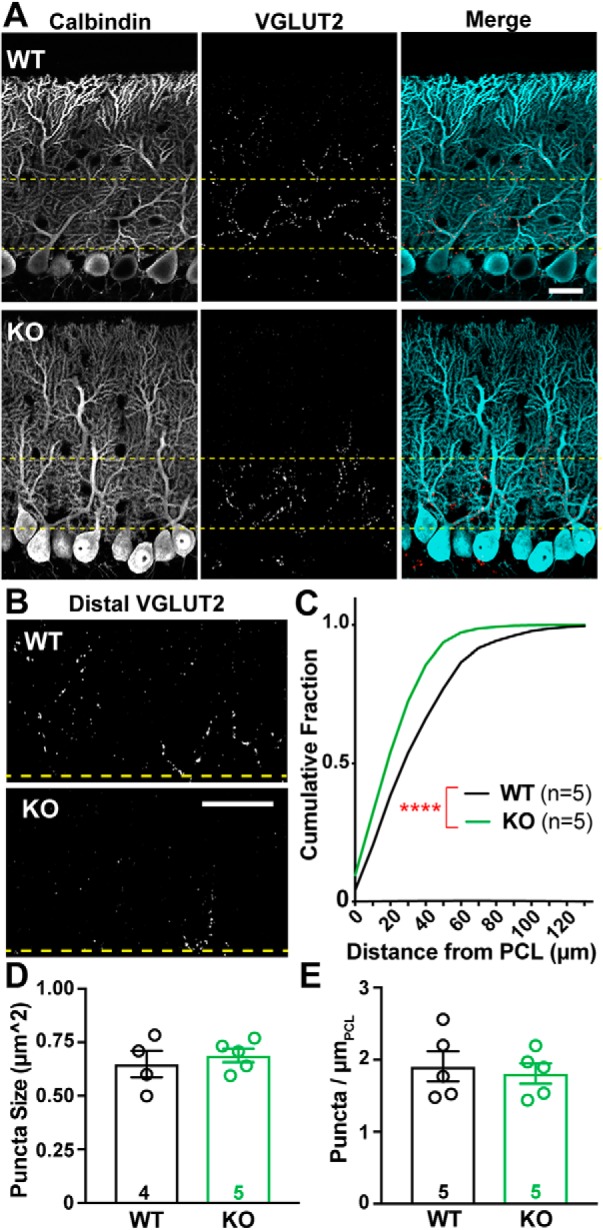
CF terminal distribution, but not number, is altered in Cacna2d2 KO cerebellum. A, Representative images from p21 WT (above) and KO (below) tissue, depicting the PCL. Calbindin (left/blue in merge) marks PCs, and VGLUT2 immunoreactivity (middle/red in merge) marks CF terminals. Yellow lines demarcate the 50 μm most proximal to PC somata and is the region most highly innervated by climbing fibers. Scale bar, 20 μm. B, VGLUT2-immunoreactive CF terminals in the outer molecular layer, cropped at the distal yellow line (50 μm), illustrate differences in CF innervation of distal PC dendrites in WT (top) and KO (below) PCs. Scale bar, 20 μm. C, Cumulative distribution of VGLUT2+ puncta relative to PC somas in WT (black, n = 5 animals) and KO (green, n = 5 animals); ****p < 0.0001 (Kolmogorov–Smirnov test). D, Average VGLUT2+ punctum size was not significantly different between WT and KO terminals; p = 0.55 (NS). E, Average VGLUT2+ puncta density per length of PCL (puncta/ μmPCL) was not significantly different between WT and KO; p = 0.72 (NS). Unless otherwise stated, Data are shown as ± SEM, n = animal; unpaired Student's t test.