Figure 5.

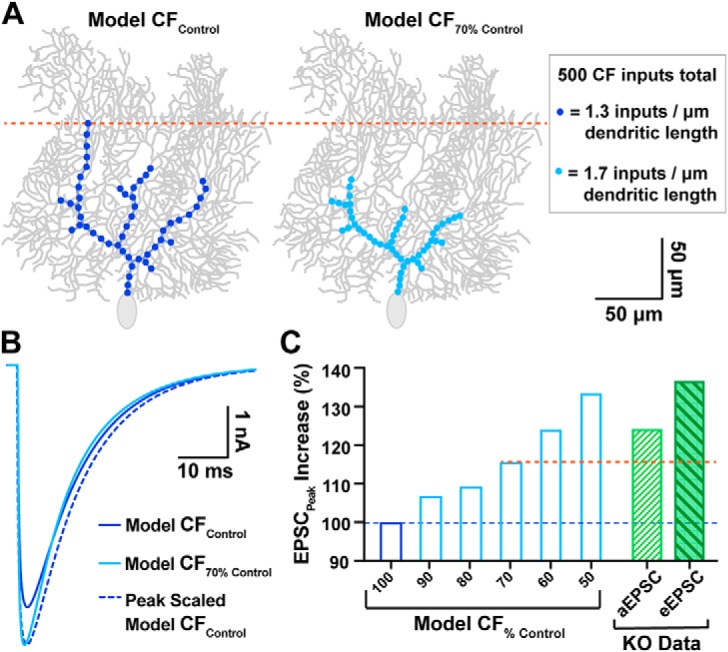
Computational PC model simulates the impact of proximally shifted CF inputs on EPSC waveform. A, Left, model CF input distribution similar to control PCs (dark blue; “model CFControl”) vs a similar PC with CF inputs shifted 30% more proximal (right, light blue, “model CF70% Control”), which matches the degree of proximal shift in WT vs KO innervation, respectively. All models conserved the total number of CF quantal inputs (500 inputs with 1 nS conductance), though input density was adjusted to accommodate the shortened region of CF innervation (see inset). B, Overlay of EPSC output waveforms from model CFControl simulations (dark blue; 4.7 nA), model CF70% Control (light blue; 5.4 nA), and peak scaled model CFControl to compare decay kinetics. For tau of decay; model CFControl τdecay = 12.0 ms; model CF70% Control τdecay = 10.2 ms). C, Predicted increase in EPSC peak amplitude for various degrees of proximally shifted model CFs (light blue bars, restricted to a zone 100–50% the width of control CFs, all including 500 quantal inputs) compared with model CFControl (dark blue bar). For comparison, the empirically determined increase in quantal EPSC (aEPSC; hatched green bar) and evoked EPSC (eEPSC; filled-hatched dark green bar) amplitudes in KO PCs are also displayed (derived from Figs. 3 and 2, respectively). The orange dotted line demarcates the predicted EPSC increase from the model based on the observed shift in CF location.
