Figure 7.
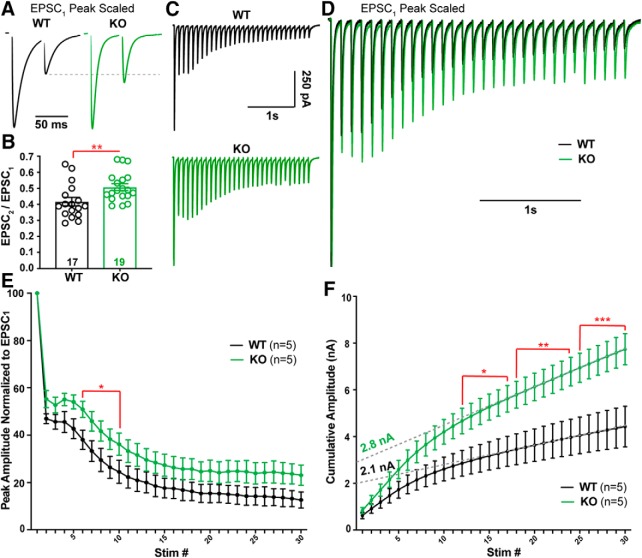
Repetitive stimulation of CF synapses reveals a lower probability of release and greater cumulative release in Cacna2d2 KO. A, Representative traces from WT (black) and KO (green) PCs during 50 ms paired-pulse stimulation. Traces are scaled to the first EPSC (EPSC1). Dotted gray line shows paired-pulse depression of the second EPSC (EPSC2) in WT compared with KO. B, Average paired-pulse ratio (EPSC2 /EPSC1); **p < 0.01. C, Representative traces in response to 10 Hz stimulation; WT (black); KO (green). D, Traces from (C) peak scaled to EPSC1 and overlaid, illustrating different relative steady-state EPSC amplitudes during latter portions of the train. E, Summary data of EPSC amplitudes normalized to EPSC1 during 10 Hz stimulation in WT (black) and KO (green). *p < 0.05 (multiple t tests with Holm–Sidak correction). F, EPSC amplitudes during 10 Hz stimulation plotted as cumulative amplitude from WT (black) and KO (green). For comparison of cumulative amplitude between WT and KO at various stimulation numbers (stim #); *p < 0.05, **p < 0.01, ***p < 0.001 (multiple t tests with Holm–Sidak correction). Dotted gray lines illustrate a linear fit to cumulative amplitude between stim # 20–30 from WT and KO trains. Data are shown as ± SEM, n = cells; unpaired Student's t test unless otherwise indicated.

