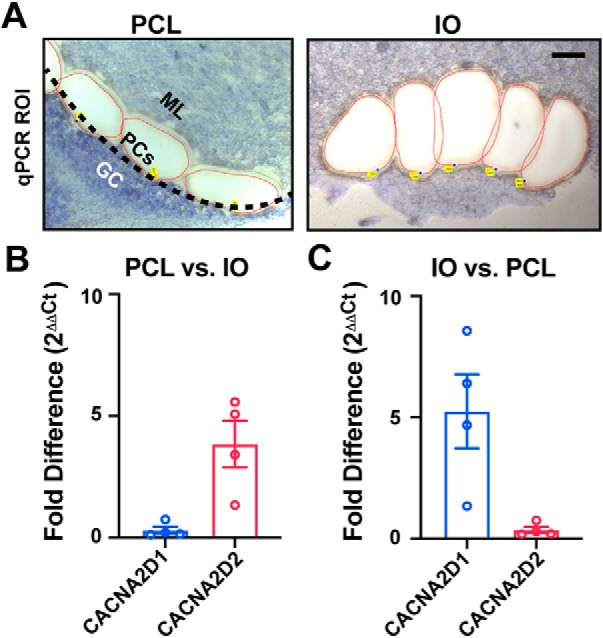
Figure 9.

Relative expression of Cacna2d transcripts by qPCR from Purkinje cell layer (PCL) and inferior olive (IO) tissues. A, Example PCL and IO regions of interest isolated by laser capture microdissection from fresh-frozen WT tissue. Left, PCL region of interest; black-dotted line indicates the monolayer of PCs that have been dissected along with regions of the inner molecular layer (ML; granule cells, GC). Right, IO region of interest; one hemisphere from a coronal section of ventral brainstem, scale = 100 μm. (B, C) Fold difference (2−ΔΔCt) expression of Cacna2d isoforms by quantitative PCR comparing (B) PCL versus IO, and (C) IO versus PCL samples. Data are shown as ± SEM, n = 4 animals.
