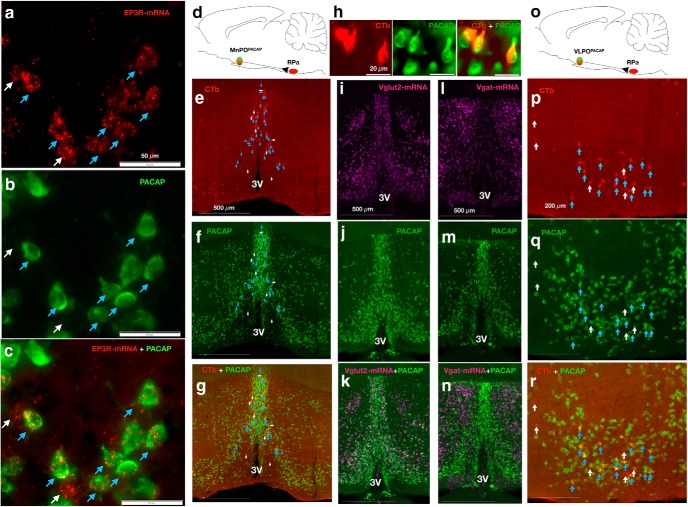
Figure 2.
PACAP+ neurons in the MnPO and VLPO express EP3R and innervate the RPa. a, RNA-scope in situ hybridization reveals EP3R-expressing neurons (red) in the MnPO of a PACAP-IRES-cre-GFP mouse. b, PACAP+ neurons (green) in the MnPO. c, Blue arrows demonstrate neurons coexpressing EP3R (red) and PACAP+ neurons (green), and white arrows show EP3R-expressing MnPO non-PACAP cells [77.06 ± 0.13% (mean ± SEM) of the EP3R-expressing MnPO neurons were PACAP+ cells]. d, Schematic figure of retrograde traditional tracer (CTb) injected in the RPa of PACAP-IRES-cre-GFP mouse. e–g, RPa-projecting MnPO neurons (red; e), MnPOPACAP neurons (green; f), and the merged image with yellow doubly labeled neurons (∼76 ± 3.6%), blue arrows demonstrate colocalization of CTb and PACAP, and white arrows CTb labeled non-PACAP cells (g). h, Higher magnification image of the RPa-projecting (red) MnPOPACAP neurons (green) from g. i–k, RNA-scope in situ hybridization for VGluT2 mRNA (magenta) in tissue from PACAP-IRES-Cre-GFP reporter mouse (i), PACAP cells in the MnPO (green; j), and k shows the colocalization (white) of PACAP and VGluT2 (55.66 ± 8.67.4% of the MnPOPACAP neurons show colocalization with VGluT2+; n = 3). l–n, RNA-scope in situ hybridization for Vgat mRNA (magenta) in tissue from aPACAP-IRES-Cre-GFP reporter mouse (l), PACAP cells in the MnPO (green; m), and PACAP neurons and Vgat (only 2.21 ± 0.27% of PACAP cells in the MnPO show colocalization with mRNA for Vgat; n). o, Schematic figure of retrograde traditional tracer (CTb) injected in the RPa of PACAP-IRES-cre-GFP mouse. p–r, RPa-projecting VLPO neurons (red; p), VLPOPACAP neurons (green; q), and the merged image (yellow) showing RPa-projecting (red) VLPOPACAP neurons (green; 40.5 ± 7.8% of the CTb labeled neurons also expressed PACAP), blue arrows demonstrate colocalization of CTb and PACAP, and white arrows CTb labeled non-PACAP cells (r). 3V, Third ventricle.

