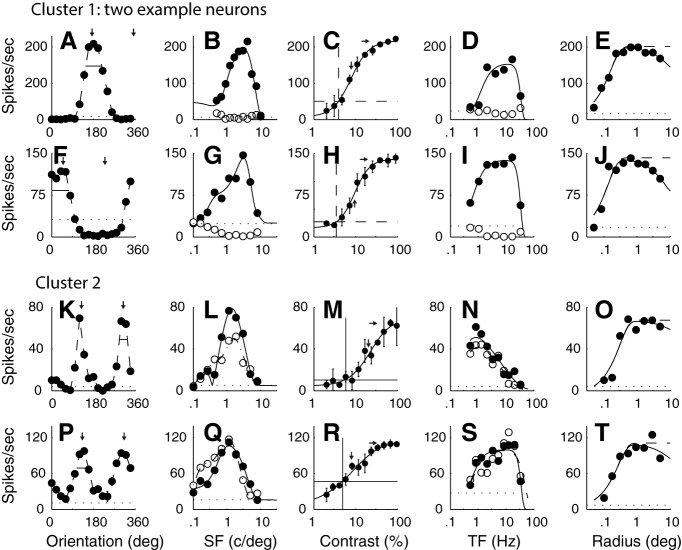
Figure 1.
The tuning functions of example neurons from the two main clusters that had f1/f0 ratios < 1. A–E, The tuning from a single neuron in C1 (f1/f0 = 0.17). F–J, The tuning for a second neuron in C1 (f1/f0 = 0.07). The neurons in C1 were orientation- and direction-selective, had low-contrast thresholds, and were bandpass in TF. There is a high response rate of these neurons, which was a characteristic of this cluster. K–O, The tuning for a neuron in C2 (f1/f0 = 0.19). P–T, The tuning for a second neuron in C2 (f1/f0 = 0.24). Neurons in this cluster were orientation-selective but not direction-selective, and were mainly low pass in TF (N), but some were bandpass (S). A, F, K, P, The response of each neuron was measured as a function of orientation to a drifting achromatic grating at the optimal SF and TF and a high contrast through a window of the optimal size. The pair of small vertical arrows in each plot indicate the optimal orientation that was selected by fitting a von Mises function to the data. Small horizontal bars represent the bandwidth, width at amplitude of √2 of the maximum. B, G, L, Q, The response of each neuron was measured as a function of SF at the preferred orientation and in both drift directions. The pairs of data in each plot indicate the response at the preferred orientation for each drift direction (filled circles represent preferred drift direction; unfilled circles represent nonpreferred drift direction). Smooth curves fitted to the data indicate a spatial receptive field model that is a difference of offset difference of Gaussians (see Materials and Methods). C, H, M, R, The response as a function of contrast was measured for each neuron at the preferred orientation, drift direction, SF, and TF in a patch of grating of the optimal diameter. Smooth curve through each dataset indicates a modified Naka-Rushton function (see Materials and Methods). Horizontal dotted line indicates the response that is 2 SDs above the response to a blank gray screen (spontaneous response). Vertical dotted line indicates the value of contrast that was taken as the contrast threshold, the point where the horizontal line intersected the fitted Naka-Rushton function. Error bars indicate SD. D, I, N, S, The response as a function of TF is shown for a grating of the optimal orientation, SF, and in both the preferred and opposite to preferred direction of drift direction (filled circles represent preferred drift direction; unfilled circles represent nonpreferred drift direction). The two datasets were fitted independently with a difference of exponentials function. Smooth curves indicate the best fitting functions. E, J, O, T, A grating of the optimal orientation, drift direction, SF, and TF and at high contrast (≥64%) was presented in a circular window of different radii. The response as a function of radius of the window is shown. Data are fitted with a difference of Gaussians function (see Materials and Methods).

