Figure 6.

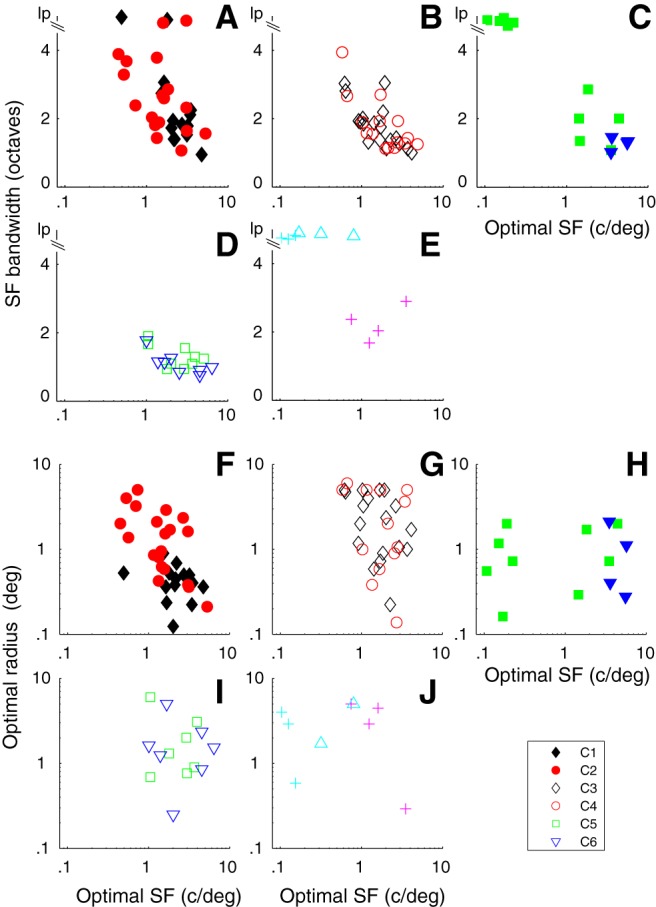
The relationship between optimal SF (osf, x axis) and SF bandwidth (sfbw, y axis, A–E) and optimal radius (F–J) for the main clusters. Cluster designation as in Figure 5. lp, Low pass. A, In C1 and C2, there is an inverse relationship between osf and sfbw for both groups. B, C3 and C4 show overlapping relationships between osf and sfbw. C, The small very direction-selective clusters (filled blue triangles) have very similar osfs and sfbws, whereas the combined clusters have a number of neurons that are low pass in SF tuning. D, C5 and C6 show narrow sfbws across a range of osfs. E, Neurons in two clusters are low pass in SF; the other is bandpass (magenta crosses). F–J, The optimal summation radius for C1 is restricted, whereas there is a broad span of optimal summation radius for other clusters. The smaller clusters are detailed in Figure 5C, E, H, J. For 5 of 85 cells in the 6 main clusters, we did not obtain area summation measures. F–J, The n in each cluster C1–C6 was 15, 20, 18, 13, 7, and 7, respectively.
