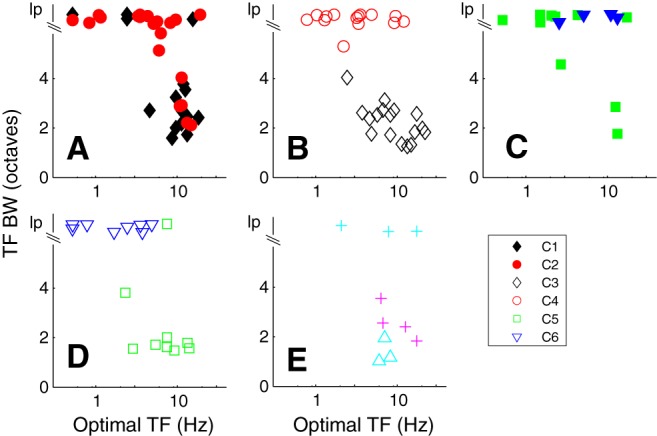
Figure 7.

The relationship between optimal TF (otf, x axis) and TF bandwidth (tfbw, y axis) for the main clusters. Cluster designation as in Figure 5. lp, Low pass. A, C1 and C2, the majority of neurons in C1 are bandpass in TF and have otfs ∼10 Hz. Many of the neurons in cluster 2 are lp in TF. B, C3 and C4 show distinct separation based on tfbw. C, The majority of the neurons in the remaining clusters with f1/f0 ratio < 1 are low pass in TF. D, C5 and C6 are separated by their tuning for TF (except 1 neuron in C5 that is lp). E, Three small clusters are distinguished by their TF tuning. The smaller clusters are detailed in Figure 5C, E.
