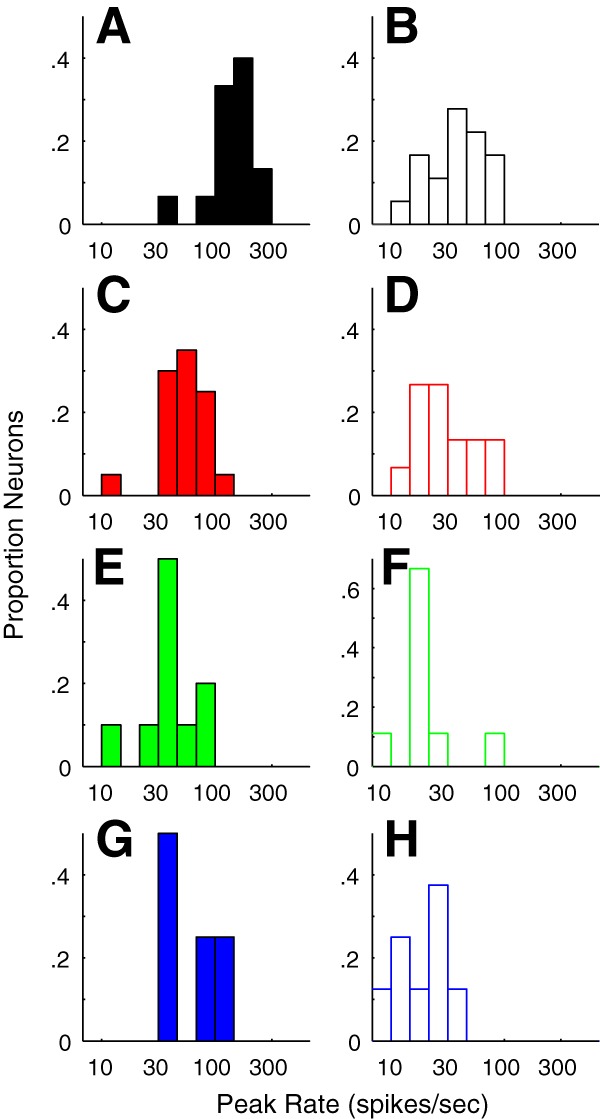
Figure 9.

Distribution of maximum firing rates (see Materials and Methods) to optimal stimuli in each cluster. A, C, E, G, The distributions of peak firing rate of neurons in C1, C2, C6, and C7, respectively, all that had f1/f0 ratios < 1. Many neurons in C1 have high maximum firing rates. B, D, F, H, The distributions of peak firing rate of neurons in C3, C4, C5, and C6 respectively, all had f1/f0 ratios > 1.
