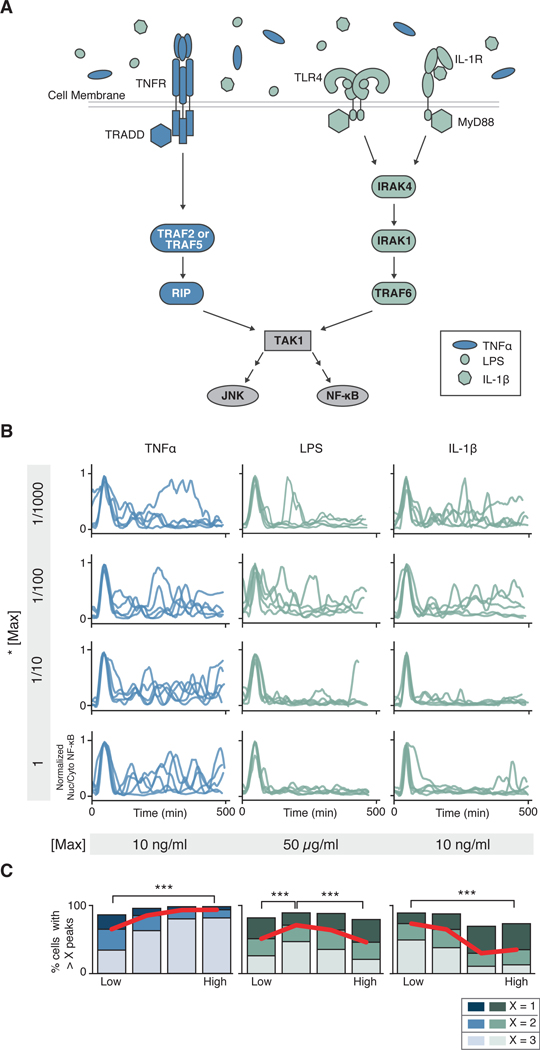
Fig. 1. The TNFR and TLR or IL-1R elicit qualitatively different dose-dependent NF-κB dynamics.
(A) Schematic representation of the innate immune signaling network. TNFα, LPS, and IL-1β activate innate immune signaling through different receptors and signaling proteins. While TLR4 (LPS) and IL-1R (IL-1β) share most signaling components, TNFR (TNFα) signals through different proteins. Both cascades lead to activation of NF-κB and MAPK signaling via TAK1. (B) Parental strain (PS) cells (NIH 3T3, RelA−/−, p65-dsRed, H2B-EGFP) were treated with increasing concentrations (top to bottom) of indicated stimuli, imaged, and quantified as described in the Methods (see sections on live cell imaging and segmentation and tracking). Five randomly selected traces from > 2,000 are shown per condition. Traces have been aligned to their first peak for clarity. (C) Peak counting quantification (see Methods for details) of the data presented in (B). Fractions of cells with more than 1, 2, or 3 peaks are shown to highlight population distribution. Data are representative of three independent experiments. High vs. Low, ***P< 0.001 by chi-square test. For TNFα, LPS and IL-1β, > 6,700, 9,600 and 11,600 cells respectively were analyzed across concentration.

