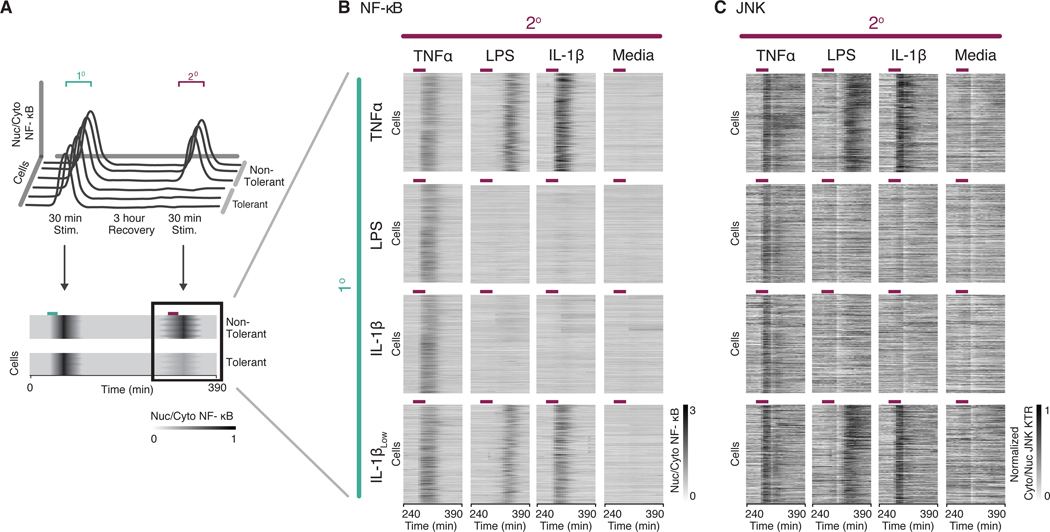
Fig. 2. TLR and IL-1R stimuli render cells cross-tolerant to further stimulation.
(A) Schematic representation of the experimental timeline. During tolerance experiments, cells were stimulated with a primary (1°) and secondary (2°) stimulation for 30 minutes with an intervening rest period of 3 hours. Traces of NF-κB activity during the secondary response were converted to heatmaps wherein rows indicate individual cells, columns indicate time, and the grayscale colormap represents nuclear to cytoplasmic median intensity ratio of p65-DsRed. (B and C) Parental Strain (PS) cells (RelA−/−, p65-DsRed, H2B-EGFP) expressing JNK-KTR-mCerulean3 were stimulated with different combinations of primary and secondary inputs as indicated (10 ng/ml TNFα, 5 μg/ml LPS, 1 ng/ml IL-1β, 0.1 ng/ml IL-1βLow), and monitored for NF-κB (B) and JNK (C) activity. Time period for secondary stimulation only is shown for clarity. Purple lines over heatmaps indicate time period when cells were in secondary stimulus. Cells were filtered to include only those responding to the primary stimulus. Data represents two independent experiments (n > 300 cells per condition, > 9,000 cells total).

