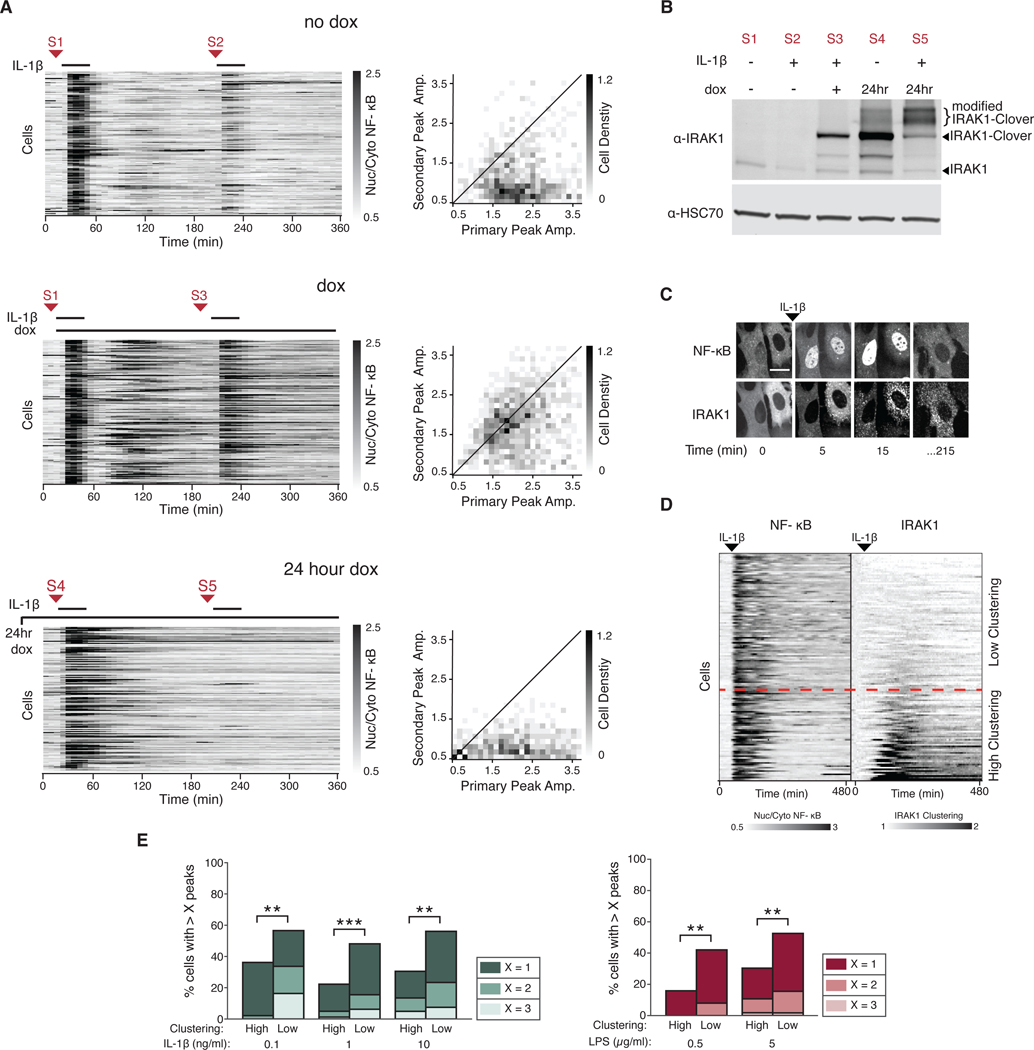
Fig. 5. Expression of unmodified IRAK1 protein bypasses tolerance.
(A) Induced expression of IRAK1 after primary stimulation. Cells containing TRE3G::IRAK1-Clover were incubated without doxycycline (no dox), with dox at the time of primary stimulation (dox), or 24 hours overnight (24 hour dox). Cells were stimulated with IL-1β (1 ng/ml) and imaged as described in the Methods. After 30 min, cells were washed and allowed to recover for 3 hours and stimulated again with IL-1β (1 ng/ml). Red arrows indicate sample collection points for the Western blot shown in (B). 2D histograms show the distribution of peak amplitudes of nuclear/cytoplasmic NF-κB median intensity during the primary vs secondary response in each cell. Black line indicates primary equals secondary NF-κB amplitude. Data represents three independent experiments with n>100 cells. (B) Western blotting for IRAK1 protein abundance between primary and secondary stimuli in cells treated as in (A) were harvested at indicated times [S1-S5, corresponding to those in A)]. HSC70 was used as a loading control. Blot is representative of three independent experiments. (C) Representative confocal images of IRAK1-Clover cluster formation following NF-kB activation. Cells stably expressing IRAK1-Clover were imaged before and after IL-1β stimulation (1 ng/ml). Scale bar, 50 μm.(D) IRAK1-Clover cells were imaged for 8 hours and stimulated with IL-1β (0.1 ng/ml) 45 min into the time course. NF-κB nuclear/cytoplasmic intensity ratio (left) and IRAK1-Clover clustering dynamics (right) are displayed in tandem. Heatmap rows are ordered top to bottom based on increasing IRAK1 clustering (see Materials and Methods). Dashed red line represents an arbitrary IRAK1 clustering threshold (1.3-fold change). (E) Grouping of cells by IRAK1 clustering separates oscillatory vs. non-oscillatory cells. Irak1-KO cells expressing IRAK1-Clover were stimulated with IL-1β (0.1, 1, and 10 ng/ml) or LPS (0.5 and 5 μg/ml). Peaks of NF-κB activity and IRAK1 clustering from single cell traces obtained in (D) and fig. S6B were measured as described in the Methods. An arbitrary threshold of 1.3-fold increase in IRAK1 clustering was used in all conditions to group high vs low IRAK1 clustering cells. Within each group, fractions of cells with more than 1, 2, or 3 peaks are shown to highlight population distribution. (n >100 cells; **P<0.01 and ***P<0.001 by chi-square test). Additional clustering quantification is provided in fig. S8A, and heatmaps of additional concentrations of IL-1β are provided in fig. S6B.

