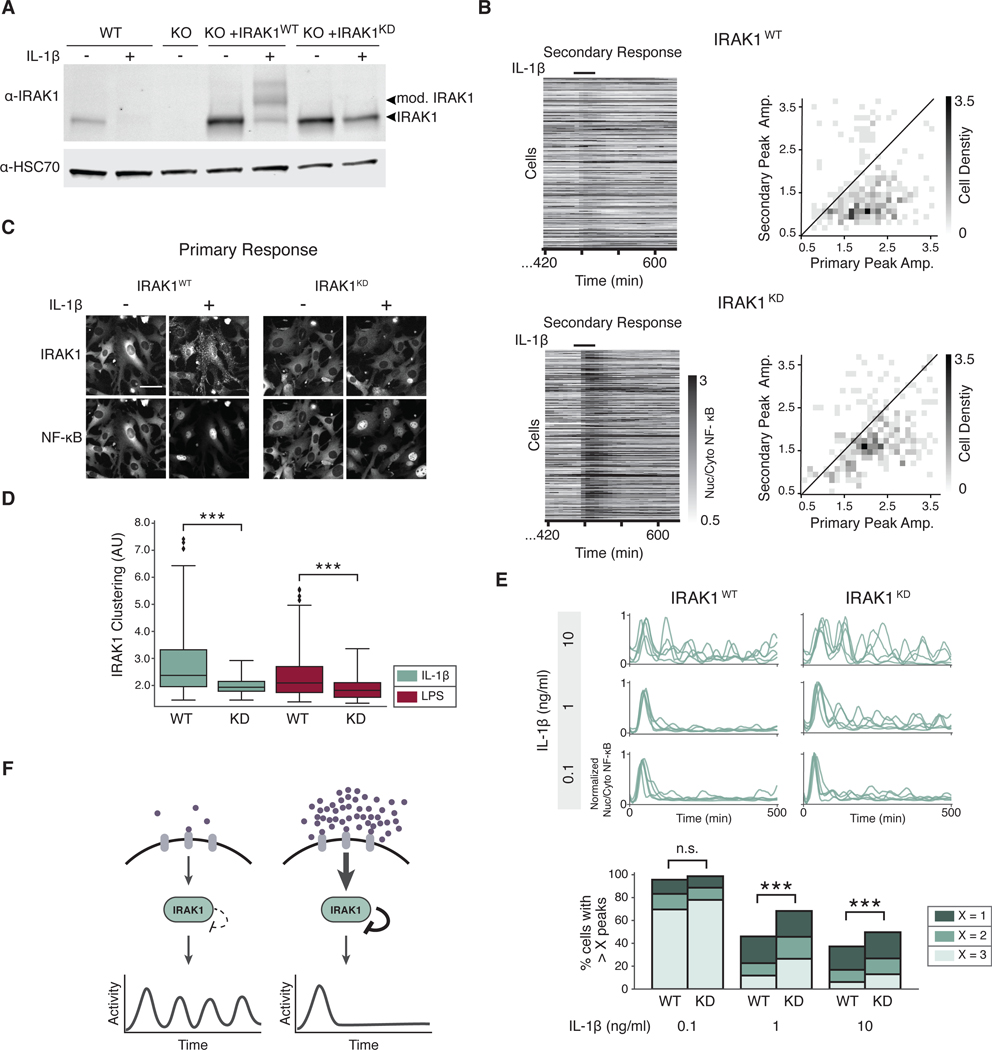
Fig. 6. IRAK1 kinase activity is critical to regulate NF-κB signaling dynamics.
(A) WT cells and Irak1-KO cells reconstituted with IRAK1WT or IRAK1KD were incubated with or without IL-1β (1 ng/ml) for 3 hours. Lysate was collected and immunoblotted against IRAK1. Arrows indicate posttranslationally modified and unmodified IRAK1 protein. HSC70 was used as a loading control. Blot is representative of 3 experiments. (B) Secondary response heatmaps of IRAK1WT or IRAK1KD cells show reduced tolerance in IRAK1KD. Irak1-KO cells reconstituted with IRAK1WT and IRAK1KD were stimulated with a 30-min pulse of IL-1β (1 ng/ml), washed, allowed to recover for 8 hours, and stimulated again with a secondary pulse of IL-1β (1 ng/ml). 2D histograms show the distribution of peak amplitudes of nuclear/cytoplasmic NF-κB median intensity during the primary vs. secondary response in each cell. Black line indicates primary equals secondary NF-κB amplitude. Data represents three independent experiments with n>100 cells. (C) Irak1-KO cells expressing IRAK1WT-Clover or IRAK1KD-Clover were imaged prior to and 20 min after stimulation with IL-1β (1 ng/ml). Representative images are shown. Scale bar, 50 μm. (D) IRAK1 clustering was quantified as described in methods in IRAK1WT-Clover or IRAK1KD-Clover cells stimulated with IL-1β (0.1 ng/ml) or LPS (0.5 μg/ml). Data represent n >100 cells; ***P<0.001 by a Kolmogorov–Smirnov test. (E) IRAK1 kinase activity regulates oscillatory dynamics. PS cells expressing IRAK1WT-Clover or IRAK1KD -Clover were stimulated with IL-1β (0.1, 1, or 10 ng/ml) and imaged for 8 hours. Five randomly selected single cell traces are presented for each condition. Peak counting of NF-κB oscillations were counted as described in methods. Fractions of cells with more than 1, 2, or 3 peaks are shown to highlight population distribution. Data represents three independent experiments with n >100 cells (n.s.= not significant; ***p < 0.001; chi-square test). See fig. S8B for TNFα data. (F) Schematic model of the effects of IRAK1-dependent autoinhibitory loop in NF-κB signaling dynamics. When ligand is in low abundance, TLR and IL-1R signaling is not inhibited after the initial activation, and continues to signal in an oscillatory pattern. When ligand concentration is high, IRAK1 kinase activity strongly inhibits signaling following the initial activation, and oscillations are not detected.

