. 2020 Mar 9;9:e52272. doi: 10.7554/eLife.52272

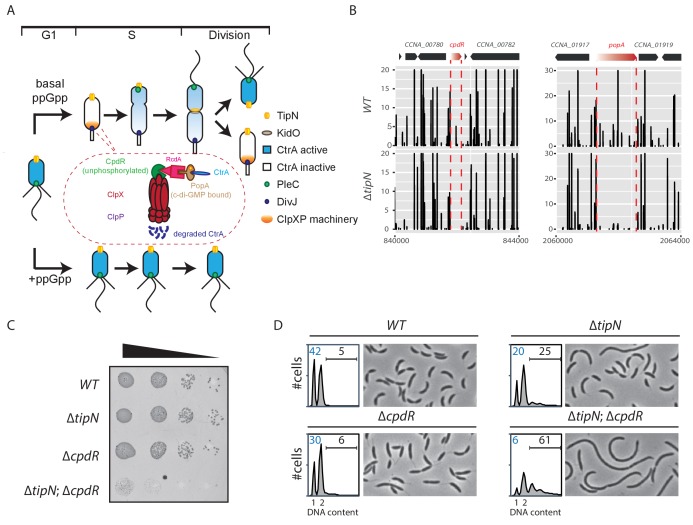
Figure 1. Synthetic sick interaction between tipN and proteolytic adaptor genes of the ClpXP machinery.

(A) Schematic of the different stages of the C. crescentus cell cycle (G1 phase, S phase and division are shown) in the normal condition (upper part). TipN (yellow dot) and KidO (brown circle) localization are represented throughout the cell cycle. Phosphorylated CtrA (blue) activates the transcription of G1 phase genes and prevents DNA replication in the swarmer cell. Upon transition from a swarmer to stalked cell, the ClpXP machinery (orange) and its adaptors CpdR (green component in the encircled ClpXP machinery), RcdA (pink component) and PopA (brown component) localize to the incipient stalked pole where it degrades CtrA, allowing DNA replication and cell division. In the pre-divisional cell, the antagonistic kinase/phosphatase pair, DivJ (purple dot) and PleC (green dot) indirectly influence the phosphorylation of CtrA with the stalked cell compartment or swarmer cell compartment, respectively. PleC promotes CtrA phosphorylation in the swarmer cell whereas DivJ prevents its phosphorylation in the stalked cell. Pili and flagella are depicted as straight and wavy lines, respectively. In the case of ppGpp production occurring under conditions of carbon or nitrogen starvation, the swarmer to stalked cell transition is prevented (bottom part). (B) Transposon libraries were generated in the wildtype (WT) and the ∆tipN mutant (MB556). The sites of Tn insertion were identified by deep sequencing and mapped onto the C. crescentus NA1000 reference genome (nucleotide coordinates depicted on the X-axis). Two regions of the genome are depicted. The height of each line reflects a relative number in sequencing reads (Y-axis) at a given nucleotide position, and all the graphs for WT and ∆tipN are scaled similarly. Tn insertions in cpdR and popA were reduced in the ∆tipN mutant when compared to the WT. (C) EOP (efficiency of plating) assays showing spot dilutions of the indicated strains (MB1 [WT], MB556 [∆tipN], MB2001 [∆cpdR], and MB2017 [∆tipN; ∆cpdR] from top to bottom). The four strains were grown overnight, adjusted at an OD600nm of 0.5 and ten-fold serially diluted. Eight microliters of each dilution were spotted onto PYE plates. (D) Flow cytometry profiles and phase contrast images of WT, ∆tipN, ∆cpdR or ∆tipN; ∆cpdR double mutants. Genome content (labelled as DNA content) was analyzed by fluorescence-activated cell sorting (FACS) during the exponential phase in peptone-yeast extract (PYE).

Figure 1—source data 1. Tn-Seq data ratio comparing Tn insertion efficiency in C. crescentus WT and mutant strains measured as sequencing reads.
The first sheet shows insertion ratios across the genome per coding sequence (CDS) and the second sheet shows the data per 100 bp window.

Figure 1.

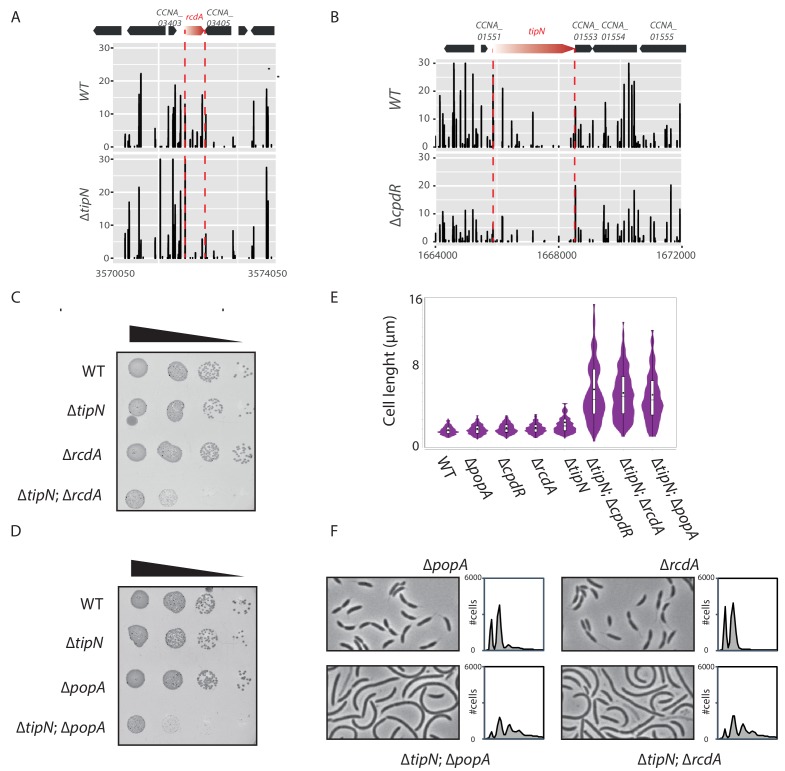
Figure 1—figure supplement 1. Genetic interactions between tipN and the genes encoding proteoyltic adaptors.

Figure 1—figure supplement 1.

(A) Transposon libraries were generated in the WT and the ∆tipN mutant (MB556). The region of the rcdA locus is depicted. (B) Transposon libraries were generated in the WT and the ∆cpdR mutant (MB2001). The tipN coding sequence is represented showing a decrease in Tn insertions in the ∆cpdR compared to the WT. In panels A and B, the numbers on the X-axis represent the nucleotide coordinates of the C. crescentus reference genome and the Y-axis indicates the corresponding relative value in sequencing reads. (C) Spot dilutions (EOP assays) of the indicated strains (MB1 [WT], MB556 [∆tipN], MB48 [∆cpdR], and MB3079 [∆tipN; ∆cpdR] from top to bottom) carried out as described for Figure 1C. (D) Spot dilutions of the indicated strains (MB1 [WT], MB556 [∆tipN], MB46 [∆popA], and [∆tipN; ∆popA] MB3075 from top to bottom) done as described in Figure 1 panel (C). (E) Cell size distribution of WT (MB1) (n = 732), ∆popA (MB46) (n = 761), ∆cpdR (MB2001) (n = 645), ∆rcdA (MB48) (n = 741), ∆tipN (MB556) (n = 477), ∆tipN; ∆cpdR (MB2017) (n = 357), ∆tipN; ∆rcdA (MB3079) (n = 497) and ∆tipN; ∆popA (MB3075) (n = 449). Strains were grown in PYE media. The cell length was measured automatically using MicrobeJ. (F) Flow cytometry profiles and phase contrast images of WT (MB1), ∆popA (MB46), ∆rcdA (MB48), and ∆tipN; ∆popA (MB3075) or ∆tipN; ∆rcdA (MB3079) double mutants. Genome content was analyzed by FACS during exponential growth in PYE.

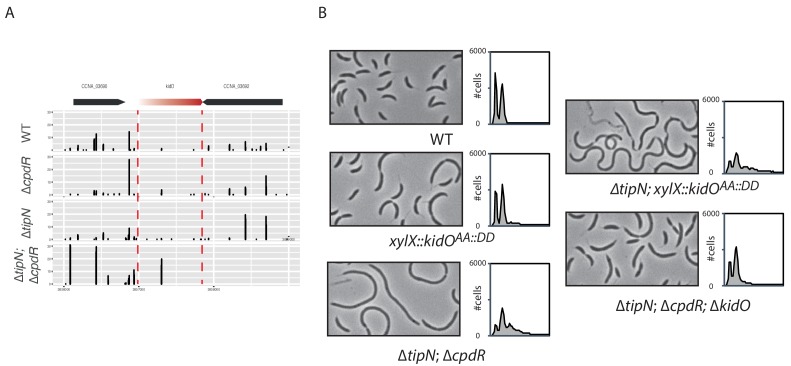
Figure 1—figure supplement 2. Cell length control by KidO in cells lacking both TipN and CpdR.

Figure 1—figure supplement 2.

(A) Transposon libraries were generated in the WT, the ∆cpdR (CC2001) and ∆tipN (MBC556) single mutants and the ∆tipN; ∆cpdR double mutant (MB2017). The sites of Tn insertion were identified by deep sequencing and mapped onto the C. crescentus NA1000 reference genome. The kidO locus is depicted. The height of each line reflects the number of sequencing reads at this position. Tn insertions in kidO was increased in the ∆tipN; ∆cpdR double mutant compared to the WT or to the ∆tipN and ∆cpdR single mutants. (B) Flow cytometry profiles and phase contrast images of the WT (MB1), the ∆tipN; ∆cpdR double mutant (MB2017), the ∆tipN;cpdR;kidO triple mutant (MB2720) and the WT (MB1972) or ∆tipN mutant (MB2366) expressing a non-degradable version of KidO (KidOAA::DD) under the control of the xylose promoter at the xylX locus. Genome content was analyzed by FACS during exponential growth in PYE. Note that the expression of KidOAA::DD was not induced with xylose because the leakage of Pxyl was sufficient to induce strong filamentation in the ∆tipN mutant.