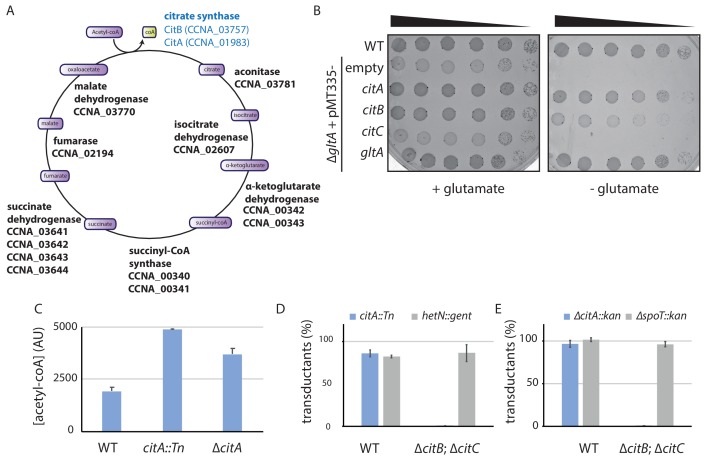
Figure 3. The C. crescentus genome encodes two functional citrate synthases.
(A) A schematic of the Krebs cycle and the corresponding gene products in C. crescentus. The two functional citrate synthases are indicated in blue. Essential gene products, as inferred from Tn-Seq (Christen et al., 2011), are highlighted in bold. (B) Spot dilutions (EOP assays) of the indicated WT and ∆gltA E. coli strains (eMB554 [WT], eMB556 [∆gltA + empty], eMB558 [∆gltA + citA], eMB560 [∆gltA + citB], eMB562 [∆gltA + citC] and eMB564 [∆gltA + gltA ] from top to bottom) on minimal medium containing glutamate or not. Only the strain carrying a functional citrate synthase can grow without glutamate. (C) LC-MS-based quantification of acetyl-CoA in extract of WT (MB1), citA::Tn (MB2622) and ∆citA (MB2559) cells grown in PYE liquid cultures. Error bars denote the standard deviation of the mean from three biological replicates. (D) ΦCR30-mediated generalized transduction frequencies of citA::Tn into WT (MB1) or ∆citBC double mutant cells (MB2679). For transduction, cells were normalized according to OD600nm ~1 and infected with the same amount of phage lysates from citA::Tn cells or with phage lysates from cells with a transposon insertion in the hetN gene (encoding gentamycin resistance) as a control for transduction. The transductants were selected on PYE plates containing gentamycin. The numbers of transduced colonies were counted after 3 days of incubation at 30°C. Error bars denote the standard deviation of the mean for three independent experiments. Cells harboring the ∆citBC mutation are not able to accept the citA::Tn mutation. (E) Same as in panel (D) using the ∆citA::kan allele or a deletion in the spoT gene (encoding kanamycin resistance, ∆spoT::kan) delivered by ΦCR30-mediated generalized transduction. Transductants were selected on PYE plates containing kanamycin.


