. 2020 Mar 9;9:e52272. doi: 10.7554/eLife.52272

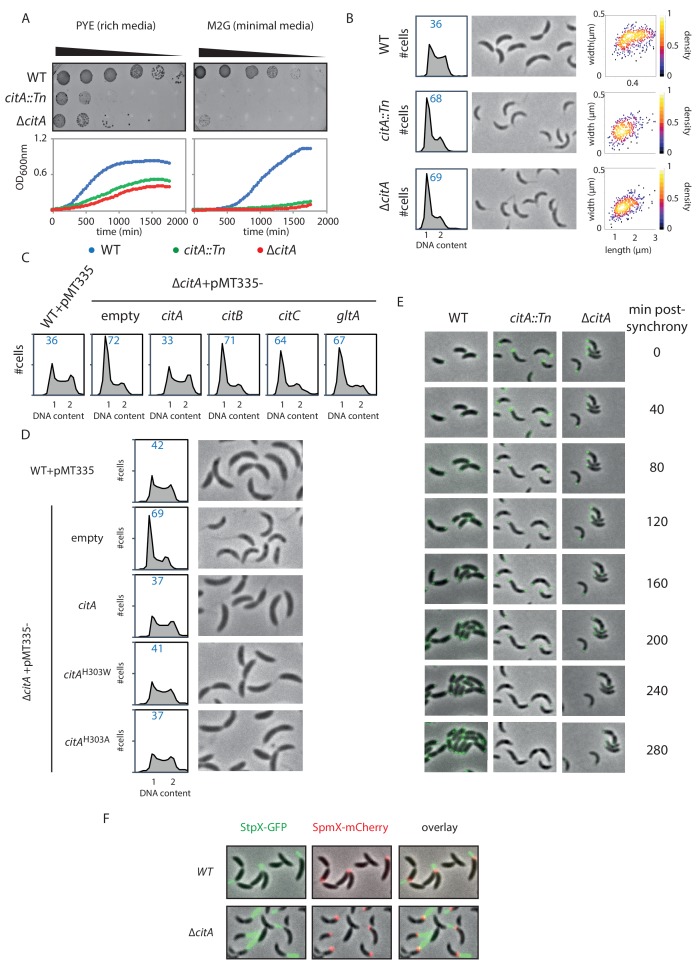
Figure 4. Inactivation of CitA induces a G1 block.

(A) Spot dilution (EOP assays) and growth curve measurements of WT (MB1), citA::Tn (MB2622) and ∆citA (MB2559) cells. For spot dilution, cells were grown overnight in PYE, adjusted to OD600nm ~0.5, and serially diluted on a rich (PYE) medium (left upper part) or on a minimal (M2G) medium (right upper part). For the growth curves, cells were grown overnight in PYE, washed twice with M2 buffer, and a similar amount of cellswas used to inoculate PYE medium (left bottom part) or M2G medium (right bottom part). (B) FACS profiles and phase contrast images of WT (MB1), citA::Tn (MB2622) and ∆citA (MB2559) cells growing exponentially in PYE. The right panel shows a scatter plot of the cell lengths and widths of each indicated population. (C) FACS profiles of ∆citA cells harboring an empty plasmid (MB3433), or a derivative with citA (MB3435), citB (MB3469), or citC (MB3471) from C. crescentus, or the citrate synthase gene (gltA) from E. coli (MB3473). WT cells harboring an empty pMT335 are also shown (MB1537). (D) FACS profiles and phase-contrast images of C. crescentus expressing a catalytic mutant of CitA. WT cells carrying an empty plasmid (MB1537), or ∆citA cells harboring an empty plasmid (MB3433) or a derivative with citA (MB3435), citAH303A (MB3439) or citAH303W (MB3437) are shown. (E) Time-lapse fluorescence microscopy of WT (MB557), citA::Tn (MB2452) and ∆citA (MB3467) cells harboring a parB::gfp-parB reporter. Cells were grown in PYE, synchronized and spotted on a PYE agarose pad. A picture was taken every 20 minutes. (F) Fluorescence microscopy of WT (MB334) and citA::Tn (MB3598) cells harboring a spmX::spmX-mCherry or a stpX::stpX-gfp reporter. Cells were grown exponentially in PYE. Each fluorescence channel is shown alone or together superimposed on phase contrast images.

Figure 4.

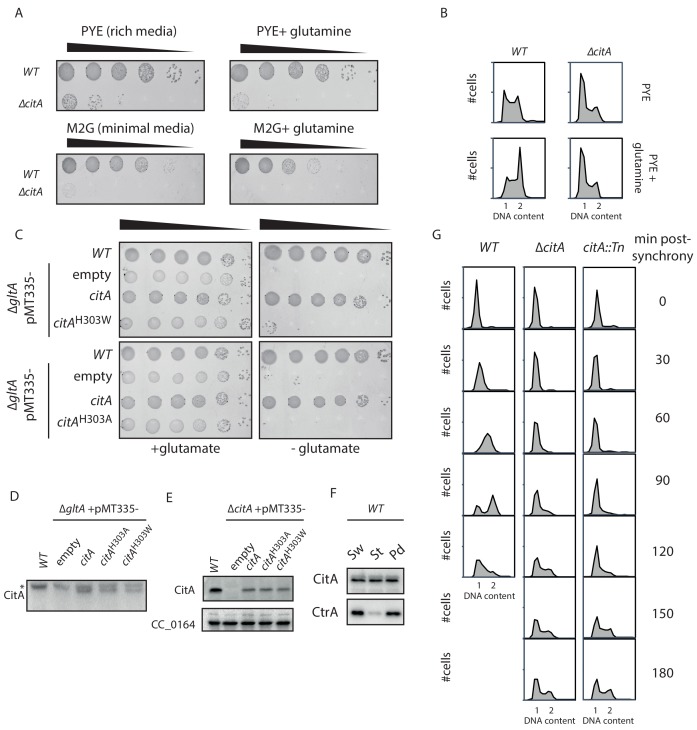
Figure 4—figure supplement 1. Addition of glutamine does not ameliorate the citA mutant phenotype.

Figure 4—figure supplement 1.

(A) Spot dilutions (EOP assays) of WT (MB1) and ∆citA (MB2559) cells. Each strain was grown overnight in PYE, adjusted to an OD600nm of 0.5, and ten-fold serially diluted on a PYE plate (upper part) or on minimal medium M2G (lower part) containing glutamine (right panel) or not (left panel). Eight microliters of each dilution were spotted onto the plates. (B) FACSprofiles of WT (MB1) and ∆citA (MB2559) cells during the exponential growth phase in PYE (upper panel) or in PYE containing glutamine (lower panel). (C) Spot dilutions of the WT E. coli carrying an empty plasmid (eMB554) or E. coligltA cells harboring an empty plasmid (eMB556) or a derivative expressing citAH303A (eMB583) or citAH303W (eMB581) on minimal medium containing glutamate (left panel) or not (right panel). Only the strain carrying a functional citrate synthase was able to grow without glutamate. (D) Immunoblot showing the abundance of CitA in the E. coli strains presented in panel (C) using an antibody to CitA. An asterisk indicates proteins that cross-react with the anti-CitA antibodies. All of the CitA variants are expressed at a similar level. (E) Immunoblot showing the abundance of CitA in the C. crescentus strains presented in Figure 4D using an antibody to CitA. All of the CitA variants are expressed at a similar level. CC_0164 serves as an immunoblot loading control. (F) Immunoblotting to determine the relative abundance of CitA and CtrA during the cell cycle of WT (MB1) C. crescentus. All strains were in synchronized in PYE and the Sw, St and Pd time point were taken at 0 minutes, 25 minutes and 60 minutes, respectively, post-synchrony. In the control, CtrA was probed to determine the quality of the synchrony. (G) FACS profiles on synchronized populations of the WT (MB1), citA::Tn (MB2622) and ∆citA (MB2559) to monitor DNA content throughout the C. crescentus cell cycle. WT (left panel), citA::gent (middle panel) and ∆citA (right panel) were synchronized and samples were withdrawn every 30 minutes and prepared for FACS analysis.