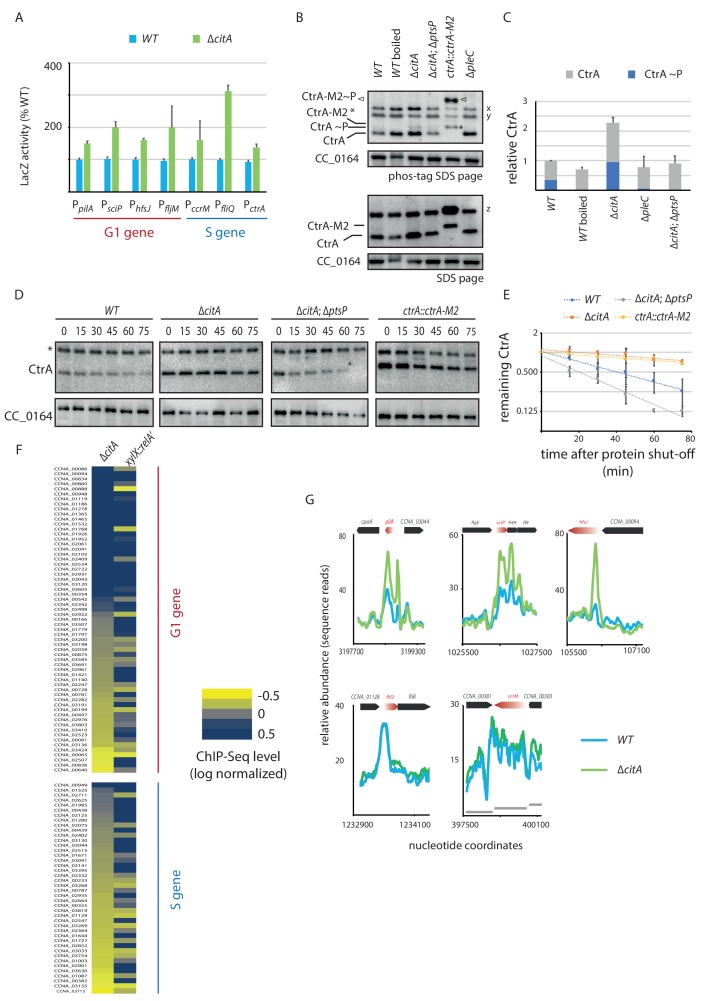
Figure 5. Absence of citA induces hyperactivation of CtrA.
(A) Promoter-probe assays of G1 (PpilA, PsciP, PhfsJ, PfljM) and S (PccrM, PfliQ, PctrA) transcriptional reporters that are directly activated by CtrA in WT or ∆citA cells. Values are expressed as relative values compared to the WT (activity in WT set at 100%). Error bars represent the standard deviation from the mean of three independent replicates. (B) Phos‐tag SDS‐PAGE (top part) immunoblots show phosphorylation of CtrA (CtrA ~P) in extracts from WT (MB1), ∆citA (MB2559) or ∆citA; ∆ptsP (MB2426) cells. As a control, boiling of a WT lysate leads to loss of detectable CtrA ~P. As additional controls, lysates from ∆pleC cells in which CtrA ~P levels are reduced (Biondi et al., 2006; Radhakrishnan et al., 2010) and from a strain harboring a tagged version (ctrA::ctrA-M2) as the only source CtrA (Domian et al., 1997) were analyzed. The same samples were analyzed by standard SDS-PAGE immunoblotting (bottom part) to measure total CtrA protein levels. In both cases, polyclonal antibodies to CtrA were used to reveal the immunoblot. The position of non-phosphorylated CtrA-M2 and phosphorylated CtrA-M2 (CtrA-M2 ~P) are indicated by a star and triangle, respectively. Non-specific bands that resulted from cross-reactivity of the antiserum to CtrA are indicated as x, y and z on the right of the immunoblots. (C) Graph showing quantification of band intensities from panel (B); the averages from two independent replicates are represented with error bars showing the standard deviations. (D) Immunoblot showing the stability of CtrA in WT (MB1), ∆citA (MB2529); ∆ptsP citA::Tn (MB2426) cells and in a strain expressing a stable variant of CtrA (NA1000; ctrA::ctrA-M2). Exponentially growing cultures were treated with chloramphenicol (50 μg.mL−1) to shut off protein synthesis. The abundance of CtrA and CC_0164 (as a loading control) was monitored over time. An asterisk indicates a contaminant band that cross-reacts with the CtrA antibody. (E) Graph showing quantification of band intensities from panel (C); averages from three independent replicates are represented with standard deviations shown as error bars. (F) Heat map to compare ChIP-Seq (chromatin immunoprecipitation coupled to deep-sequencing) performed with antibodies recognizing the RNAP on chromatin from WT (MB1), ∆citA (CC2529) and a strain expressing relA’-FLAG from the xylX promoter (MB3282). Direct targets of CtrA, classified into two classes—G1 and S—are represented. The color key indicates the degree to which the occupancy of RNAP is altered in the different genetic background compared to WT expressed as log2 ratio. (G) ChIP-Seq traces of RNAP on different CtrA target promoters in WT (MB1) (blue line) or ∆citA (MB2529) (green line) cells. Genes encoded are represented as boxes on the upper part of the graph, red genes indicate the gene of interest represented.


