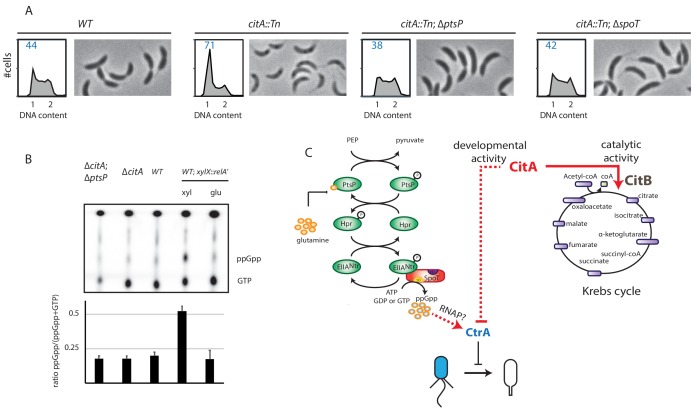
Figure 6. Absence of (p)ppGpp counteracts the ∆citA phenotype.
(A) Flow cytometry profiles and phase contrast images of WT (MB1), citA::Tn (MB2622), ∆spoT citA::Tn (MB2413) and ∆ptsP citA::Tn (MB2426) cells. Genome content was analyzed by FACS during the exponential growth phase in PYE. (B) Intracellular levels of (p)ppGpp in WT, ∆citA (MB2529), ∆citA; ∆ptsP (MB2426) and (as a positive control) RelA’-FLAG-expressing cells (MB3282). Cells were cultivated in PYE. MB3282 was cultivated in PYE for 3 hours and, then, cultures were divided in two. Glucose 0.2% or xylose 0.3% was added to repress or induce the induction of relA’-FLAG for one hour. The TLC autoradiograph image shown in the upper part of the figure was used to calculate the ppGpp/(GTP+ppGpp) shown in the lower panel. Error bars represent the standard deviations of the means from three independent replicates. (C) Scheme of the PtsNtrsignalling pathway (Ronneau et al., 2016) Intracellular glutamine regulates the autophosphorylation of PtsP. Under nitrogen starvation, the glutamine pool drops, triggering PtsP phosphorylation that leads to an increase of phosphorylated EIINtr. Once phosphorylated, EIINtr inhibits the hydrolase activity of SpoT, leading to the accumulation of (p)ppGpp, which acts as a positive regulator of CtrA and is bound by RNA polymerase (RNAP). The two functions of CitA are represented, one as a metabolic enzyme in the Krebs cycle and the other in the development of C. crescentus involving negative activity on CtrA that is independent of its catalytic activity. Dashed lines indicate that the suspected action on CtrA is indirect.


